Type 1 DiabetesAvailable
BetaIntercept™ T1D
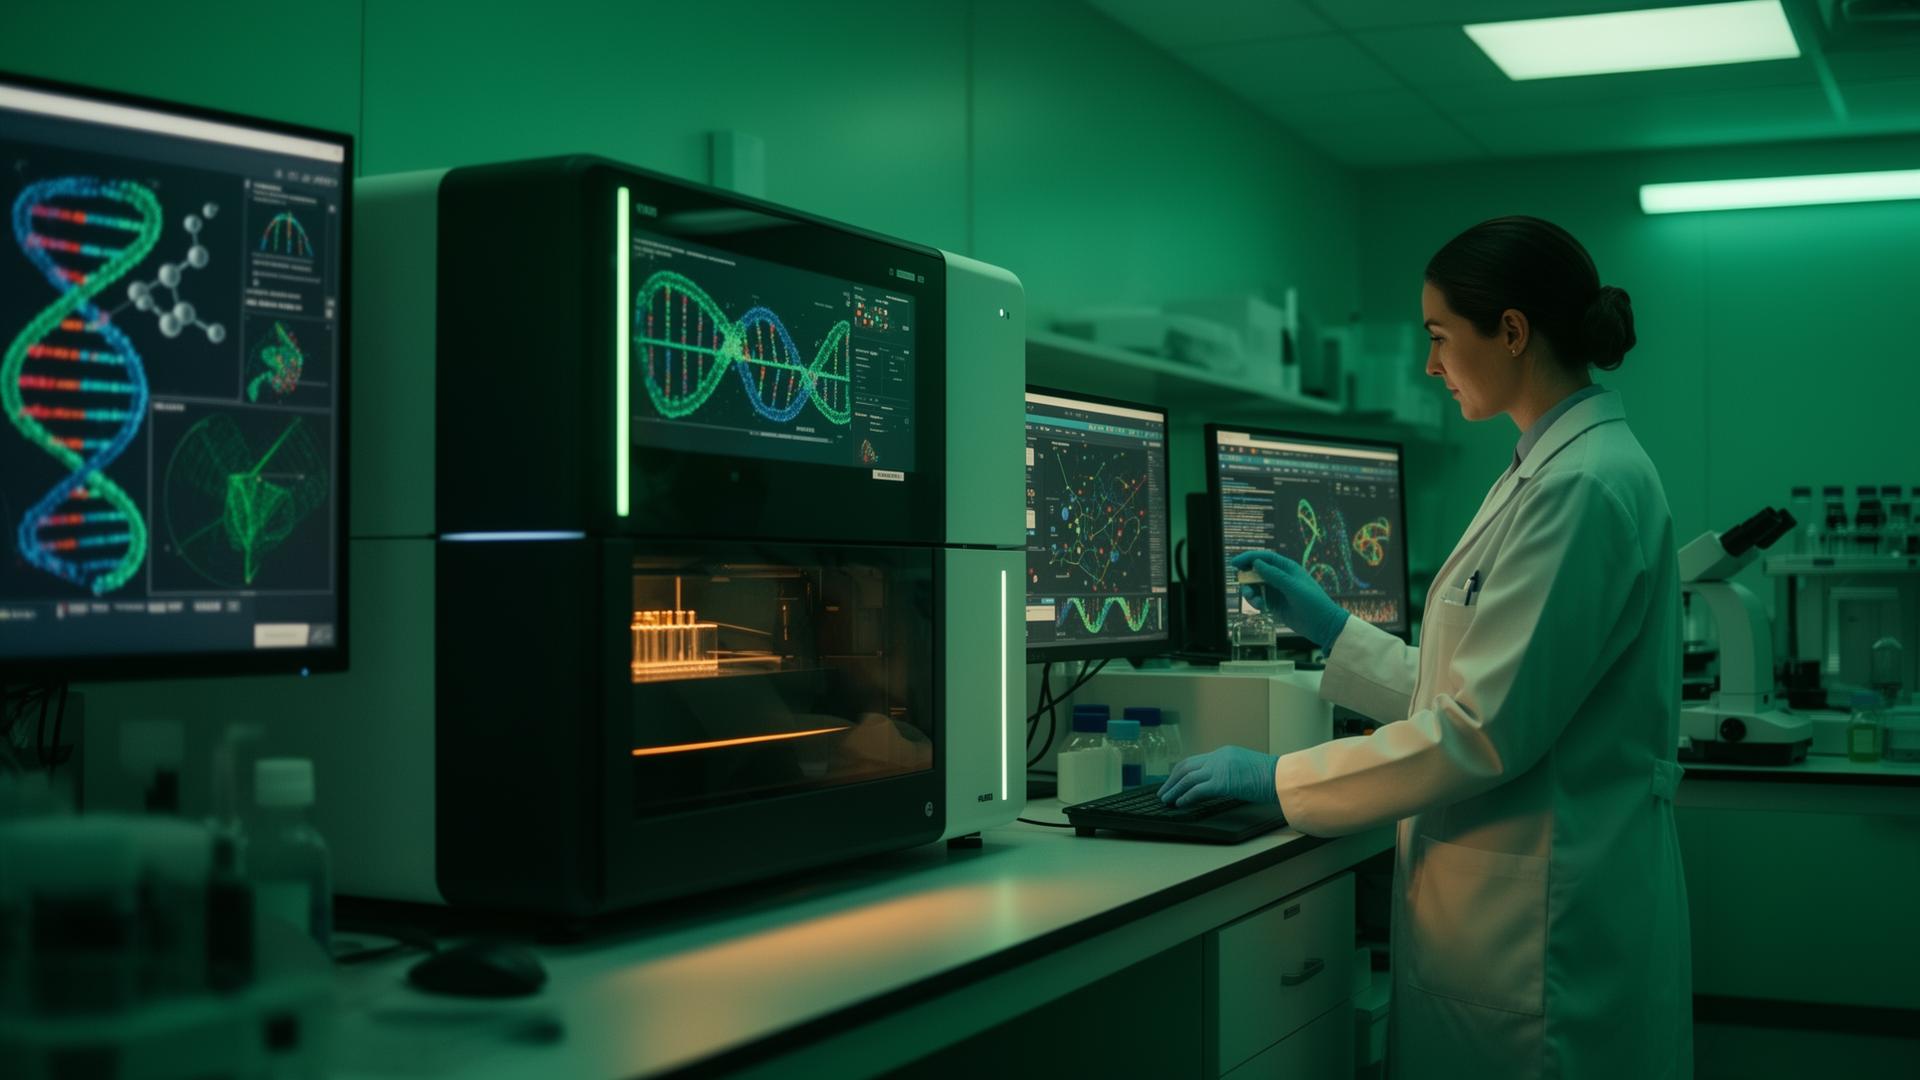
Early detection and longitudinal monitoring of Type 1 Diabetes through beta-cell derived cfDNA.

Intercept IQ™ is a scalable molecular diagnostics platform that powers disease interception across clinical care, research, pharmaceutical development, and population health through a single integrated technology platform.
One Platform. Multiple Disease-Specific Diagnostics.
Every Kihealth diagnostic is built from the same proprietary molecular engine — tuned for a specific disease, patient population, and clinical workflow. Kihealth is a platform company, not a collection of unrelated products.
Early detection and longitudinal monitoring of Type 1 Diabetes through beta-cell derived cfDNA.
Detection and monitoring of progressive beta-cell dysfunction in Type 2 Diabetes.
Blood-based molecular diagnostics for pancreatic cancer and future oncology applications.
Blood-based molecular diagnostics supporting earlier detection of Alzheimer's and future neurodegenerative disorders.
Intercept IQ™ powers products across every arm of the Kihealth family.
From pediatric prevention to pharmaceutical development, Intercept IQ™ generates molecular intelligence across the full continuum of care and discovery.
Identify ongoing beta cell injury before clinical diagnosis, enabling earlier intervention and longitudinal monitoring in at-risk pediatric populations.
Detect progressive beta cell dysfunction and support earlier identification of metabolic disease before irreversible pancreatic damage occurs.
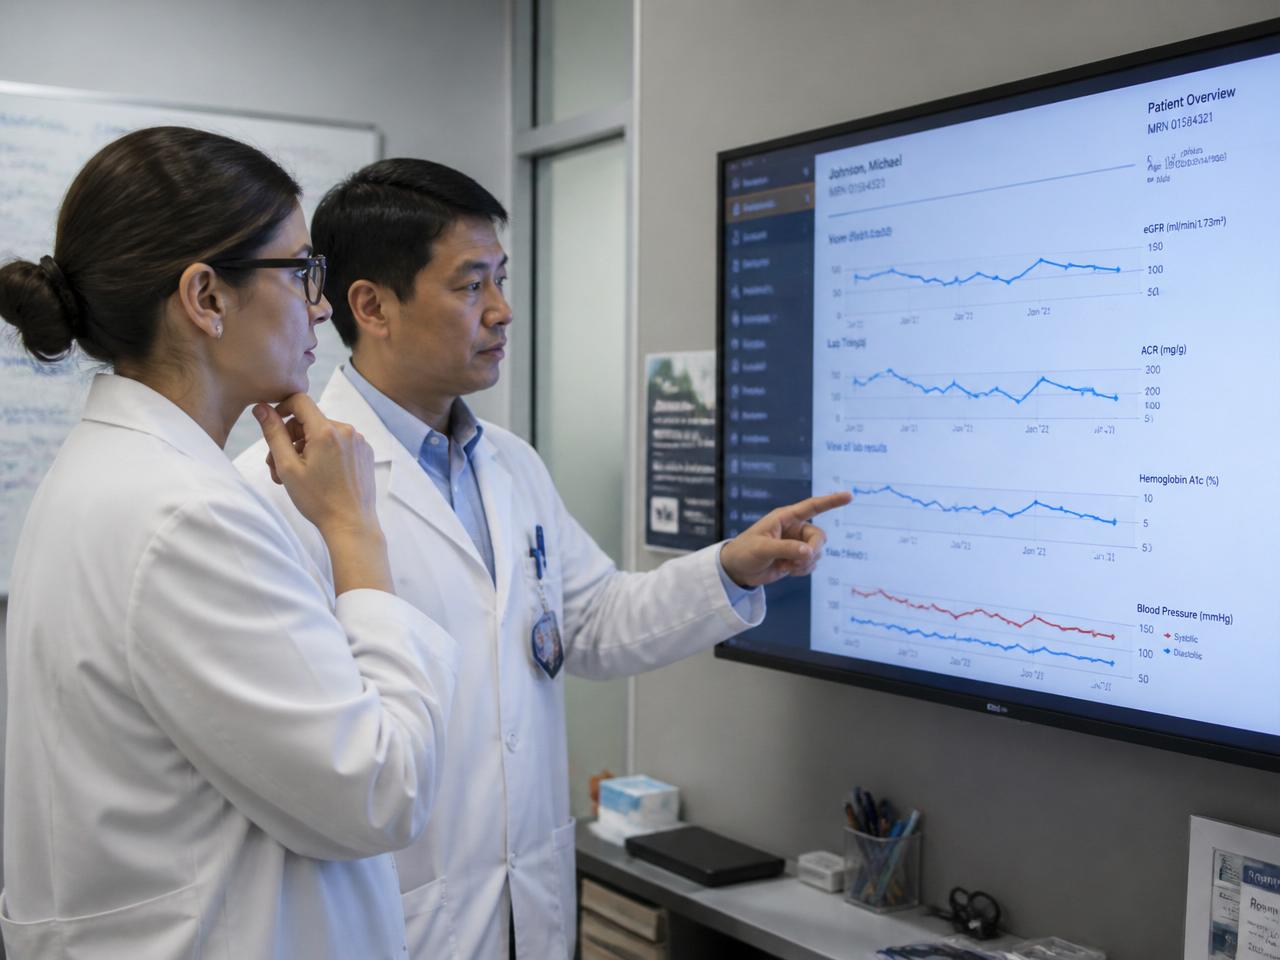
Provide clinicians with actionable molecular intelligence that complements traditional biomarkers to improve diagnosis, monitoring, and treatment decisions.
Support large-scale screening initiatives designed to identify individuals at elevated metabolic risk before symptomatic disease develops.
Improve patient selection, risk stratification, and endpoint evaluation for metabolic disease clinical trials.
Support companion diagnostics, therapeutic development, and biomarker-driven clinical research for pharmaceutical partners.
Monitor biological response to GLP-1 therapies using longitudinal beta cell health measurements to complement traditional metabolic assessments.
Track changes in beta cell biology over time to evaluate disease progression and therapeutic effectiveness through serial testing.
Provide investigators with advanced molecular tools for translational research, biomarker discovery, and precision medicine studies.

BetaIntercept™ T1D detects beta-cell derived cfDNA released during ongoing pancreatic injury — a molecular signal that can appear years before autoantibody seroconversion or dysglycemia. For pediatric patients with family history or elevated genetic risk, this creates a window for closer monitoring, earlier education, and intervention before overt disease.

By the time HbA1c is elevated, up to 50% of beta cell function may already be lost. BetaIntercept™ T2D reveals beta cell stress and injury upstream of traditional glycemic markers — allowing clinicians to identify high-risk adults during the prediabetic window when lifestyle, pharmacologic, and metabolic interventions are most effective.

Intercept IQ™ integrates methylation-based molecular signals with traditional biomarkers to give clinicians a fuller picture of underlying disease biology. Results are delivered in a clinician-friendly report with risk stratification, longitudinal trends, and evidence-based interpretation to support real-world clinical workflows.

The Intercept IQ™ platform is designed to operate at population scale. From employer wellness programs to national prevention initiatives, the same core assay supports high-throughput identification of at-risk individuals — enabling health systems and public health agencies to shift resources from late-stage treatment to early intervention.
Intercept IQ™ supports pharmaceutical and academic sponsors with biomarker-driven trial design — from smarter enrollment based on underlying beta cell biology, to longitudinal endpoints that reveal drug effect earlier and more precisely than traditional clinical measures.

As precision medicine reshapes drug development, diagnostics become inseparable from therapeutics. Intercept IQ™ can be adapted to serve as a companion diagnostic — identifying the right patients, validating mechanism of action, and providing pharmacodynamic readouts across development phases.

GLP-1 receptor agonists have transformed metabolic care, but clinicians still lack tools to assess whether therapy is preserving underlying beta cell function. Intercept IQ™ delivers a molecular readout of beta cell status over time — helping personalize dosing, evaluate response, and quantify durable metabolic benefit.
Chronic disease unfolds over years — a single test cannot capture its trajectory. Serial Intercept IQ™ testing plots the biology of disease progression over time, revealing whether a patient is stable, improving, or accelerating toward complications, and quantifying the biological impact of interventions.
Kihealth partners with academic investigators, consortia, and research networks to enable translational science. Intercept IQ™ supports biomarker discovery, mechanistic studies, and multi-center collaborations spanning metabolic, autoimmune, and oncologic disease biology.
Kihealth is building more than a diagnostic test. We are developing a platform designed to generate biological intelligence across prevention, clinical care, therapeutic innovation, research, and population health.
"The future of healthcare will be driven by earlier detection, deeper biological insight, and more informed decision-making. Kihealth intends to help power that future."
Six tightly coupled stages convert routine plasma into a CLIA-grade readout of active disease biology. Scroll to walk the pipeline.
A single standard Norgen tube. No imaging, no biopsy, no specialized collection.
Centrifugation separates plasma from cellular components within minutes of draw, preserving fragile cell-free signal.
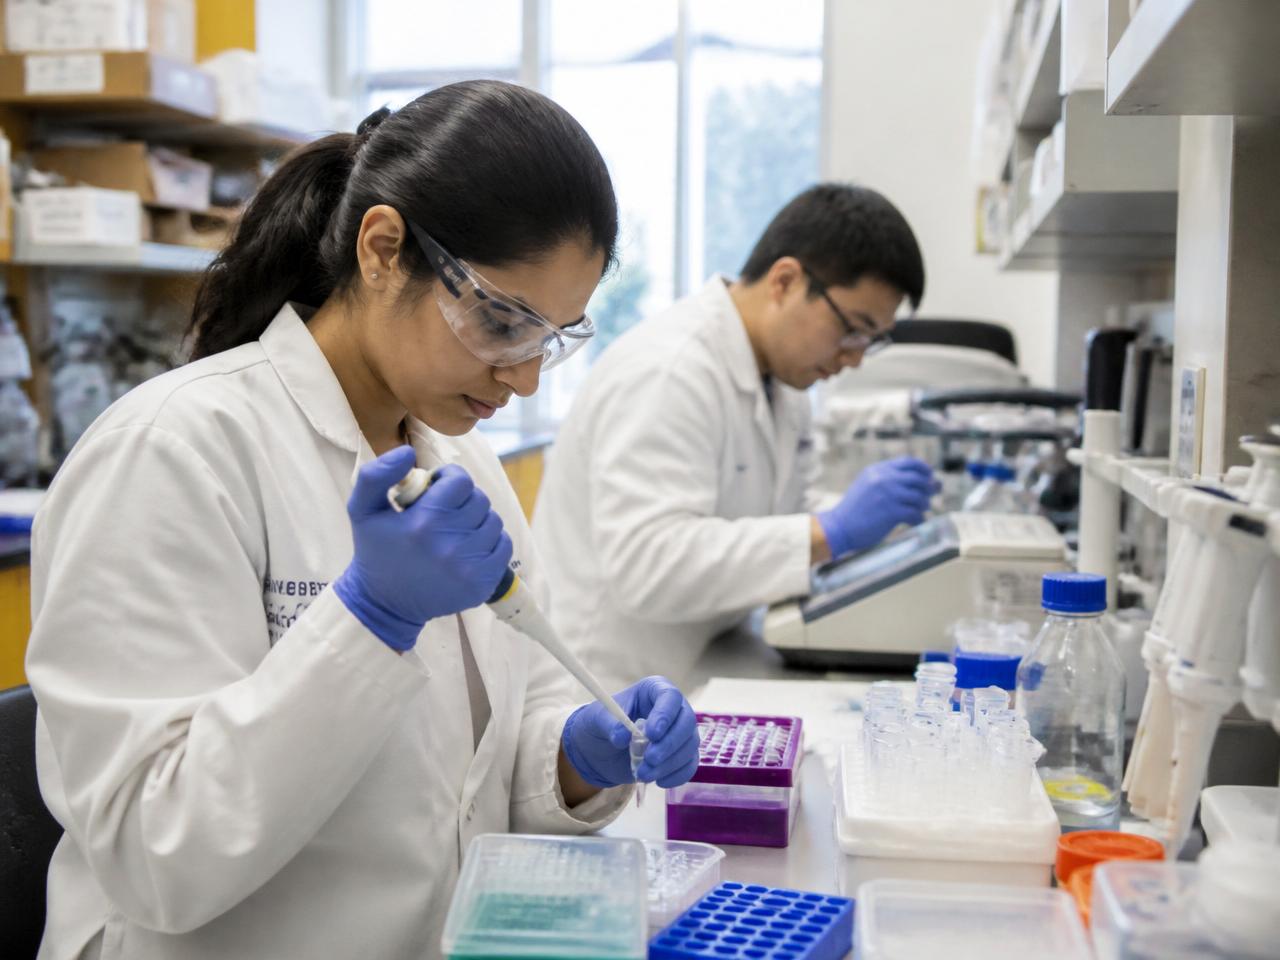
Sub-nanogram cfDNA fragments — released by dying cells across every tissue — are captured and prepared for deep sequencing.
30–120× whole-genome bisulfite sequencing resolves methylation, fragmentomic, and end-motif signatures unique to each tissue and disease state.
Multi-task models trained on hundreds of thousands of prospectively collected samples infer tissue-of-origin and active disease biology from 2.4M features per sample.
Physician-facing reports surface tissue-of-origin, disease state, and confidence — backed by analytical and clinical validation, in language clinicians act on.
Disease begins as cellular injury, becomes molecular change, then biomarker shift, then symptom. InterceptIQ™ reads the molecular signal at the moment of cellular injury — long before any clinical test would register a result.

The natural history of Type 1 Diabetes plotted along its molecular and clinical timeline. cfDNA signal rises the moment β-cells begin to die — years before HbA1c moves.
Homeostasis
Autoimmune attack begins
cfDNA signal rises
Autoantibodies appear
Hyperglycemia, polyuria, weight loss
HbA1c, fasting glucose, OGTT
cfDNA β-cell methylation
Years 1–3 before symptoms
Pancreatic islet β-cells maintain insulin secretion. No autoimmune activity, no measurable tissue injury.
T-cell infiltration triggers β-cell apoptosis. Dying cells release fragments of methylated DNA into circulation.
Unmethylated INS gene cfDNA fragments and β-cell-specific methylation marks accumulate in plasma — years before glucose dysregulation.
GAD65, IA-2, and ZnT8 autoantibodies become detectable. β-cell mass loss accelerates past 50%.
Clinical symptoms emerge once functional β-cell reserve is largely exhausted. Patient presents to primary care.
Standard-of-care diagnosis confirms T1D. By this point, >80% of β-cell mass is irreversibly lost.
Illustrative T1D natural history. Lead-time estimates supported by Akirav et al., Herold et al., and ongoing prospective InterceptIQ™ cohorts. Indicative — not for diagnostic use.
The InterceptIQ pipeline is a continuous instrument loop. Every stage is quality-controlled, traceable, and engineered to preserve fragmentomic detail from picogram-level input through clinical reporting.
Proprietary low-input library chemistry preserves fragmentomic detail from <1 ng of cfDNA.
Deep whole-genome bisulfite sequencing at 30×–120×, scaled across hundreds of thousands of samples.
Federated AI infers tissue-of-origin and disease state from 2.4M features per sample.
Five tightly coupled layers — wet lab to clinical report — each instrumented, quality-controlled, and engineered for regulatory and payer review.
Rather than relying on a single biomarker, InterceptIQ™ interrogates multiple tissue-specific methylation loci across the insulin gene. The joint signal raises specificity, lowers false-positive rate, and produces a clinically interpretable disease intelligence output.
Open chromatin in pancreatic β-cells; hypermethylated in non-β tissue.
β-cell specific demethylation; conserved across human islet donors.
Independent confirmatory locus; lowers false-positive rate vs. single-site assays.
Calibrated weighted combination — auditable, interpretable, and reproducible across cohorts.
Our models are trained on prospectively collected, IRB-approved cohorts and audited for confounding, leakage, and demographic generalization. Every classifier ships with an interpretability layer that maps predictions back to biological features — critical for regulatory review and clinician trust.
See peer-reviewed methods →Sample KH-PLT-0421 · synthetic readout for illustration
Tissue-of-origin
Methylation atlas
47 cell types
Fragmentomic readout
cfDNA · bp
Methylation grid · chr11