
A1c
Glycemic exposure over time
A1c reflects average blood-glucose exposure over approximately the preceding two to three months, with greater influence from more recent glucose levels.

Kihealth Labs · Scientific Foundation
Kihealth combines tissue-specific molecular diagnostics, high-complexity laboratory science and longitudinal analytics to study the biological processes underlying type 1 diabetes, prediabetes and type 2 diabetes.
The Biological Problem
Diabetes develops through a biological continuum. Changes in autoimmunity, beta-cell stress, insulin-producing capacity and glycemic regulation can emerge at different times and progress at different rates.
Established biomarkers provide essential information about this process — but each measures a different part of the disease. None directly quantifies active beta-cell injury or death.
Glycemic exposure over time
A1c reflects average blood-glucose exposure over approximately the preceding two to three months, with greater influence from more recent glucose levels.
Current or recent glycemic status
A traditional blood-glucose measurement provides a snapshot of circulating glucose at a particular point in time. Repeated measurements or continuous glucose monitoring can provide a broader picture of glycemic patterns.
Endogenous insulin secretion
C-peptide is released when the body produces insulin and is used to assess endogenous insulin secretion and residual beta-cell function.
Evidence of islet autoimmunity
Islet autoantibodies identify an immune response directed toward pancreatic islet targets and support T1D risk assessment, classification and staging.
Current
Current
Current
Current
New Signal
The Unmet Need
A patient may have evidence of autoimmunity, declining insulin production or worsening glycemic control — but these measurements do not directly quantify the cellular injury occurring within the beta cell.
A complementary molecular biomarker could help researchers study when beta-cell injury is occurring, how it changes over time and how it relates to disease progression and treatment response.
Kihealth is developing a complementary molecular view of diabetes biology — one focused on what is happening to the beta cell itself.
Through the Beta Intercept program, Kihealth measures circulating differentially unmethylated INS cfDNA, a molecular signal associated with pancreatic beta-cell injury and death.
The objective is to evaluate whether this signal can add biological information beyond measurements of autoimmunity, remaining function and glycemic exposure.
Conventional biomarkers show essential consequences and context. Beta Intercept is being developed to investigate the underlying cellular event. Together, these measurements may provide a more complete view of diabetes biology.
See What Kihealth MeasuresThe Role of the Beta Cell
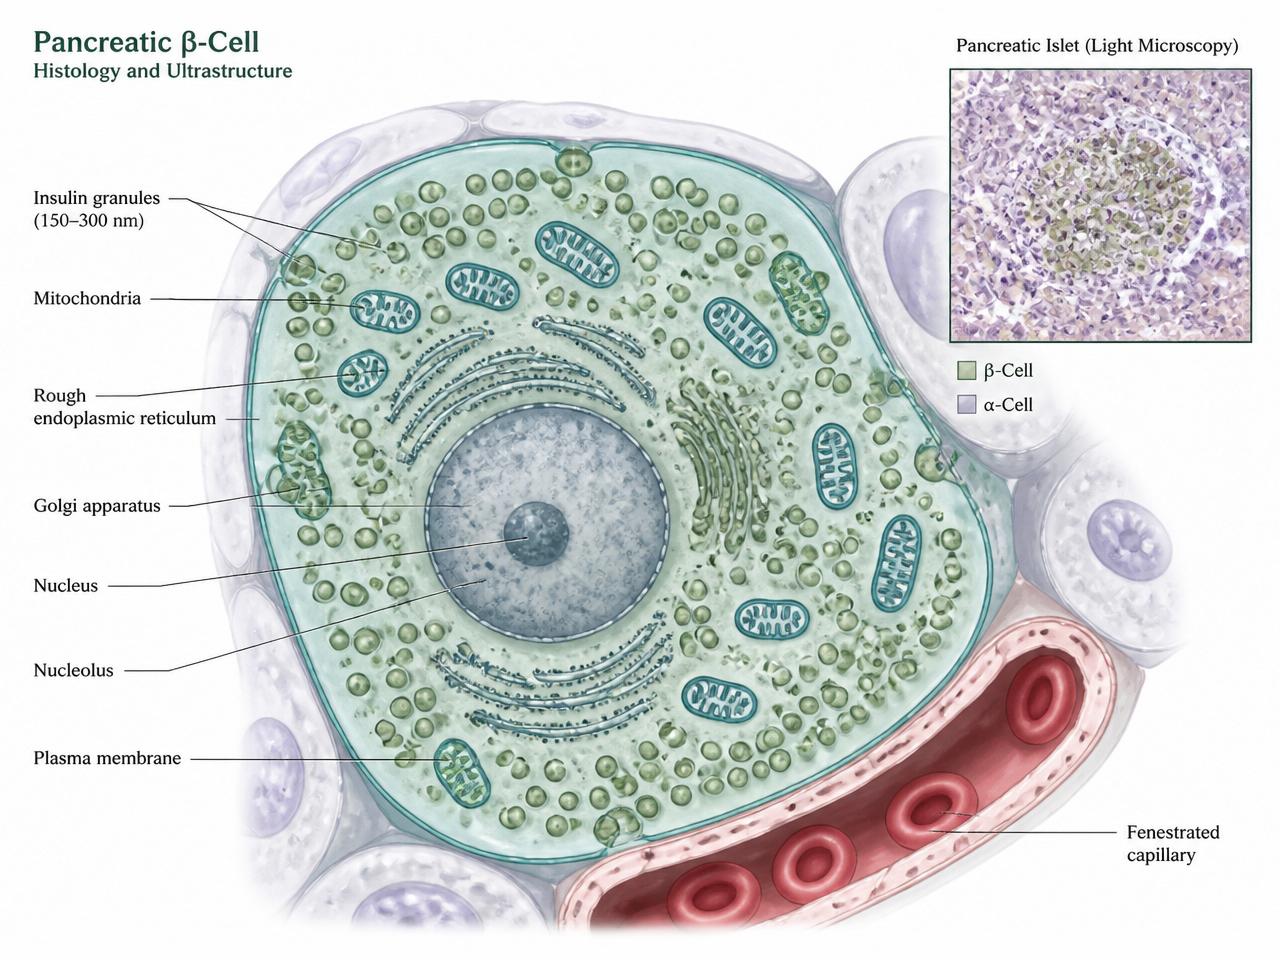
Pancreatic beta cells are specialized cells within the islets of Langerhans that produce and secrete insulin in response to changing glucose levels. Their ability to sense glucose and deliver an appropriate insulin response is essential to metabolic regulation.
Type 1 and type 2 diabetes arise through different biological pathways, but both involve progressive disruption of beta-cell health, function or survival.
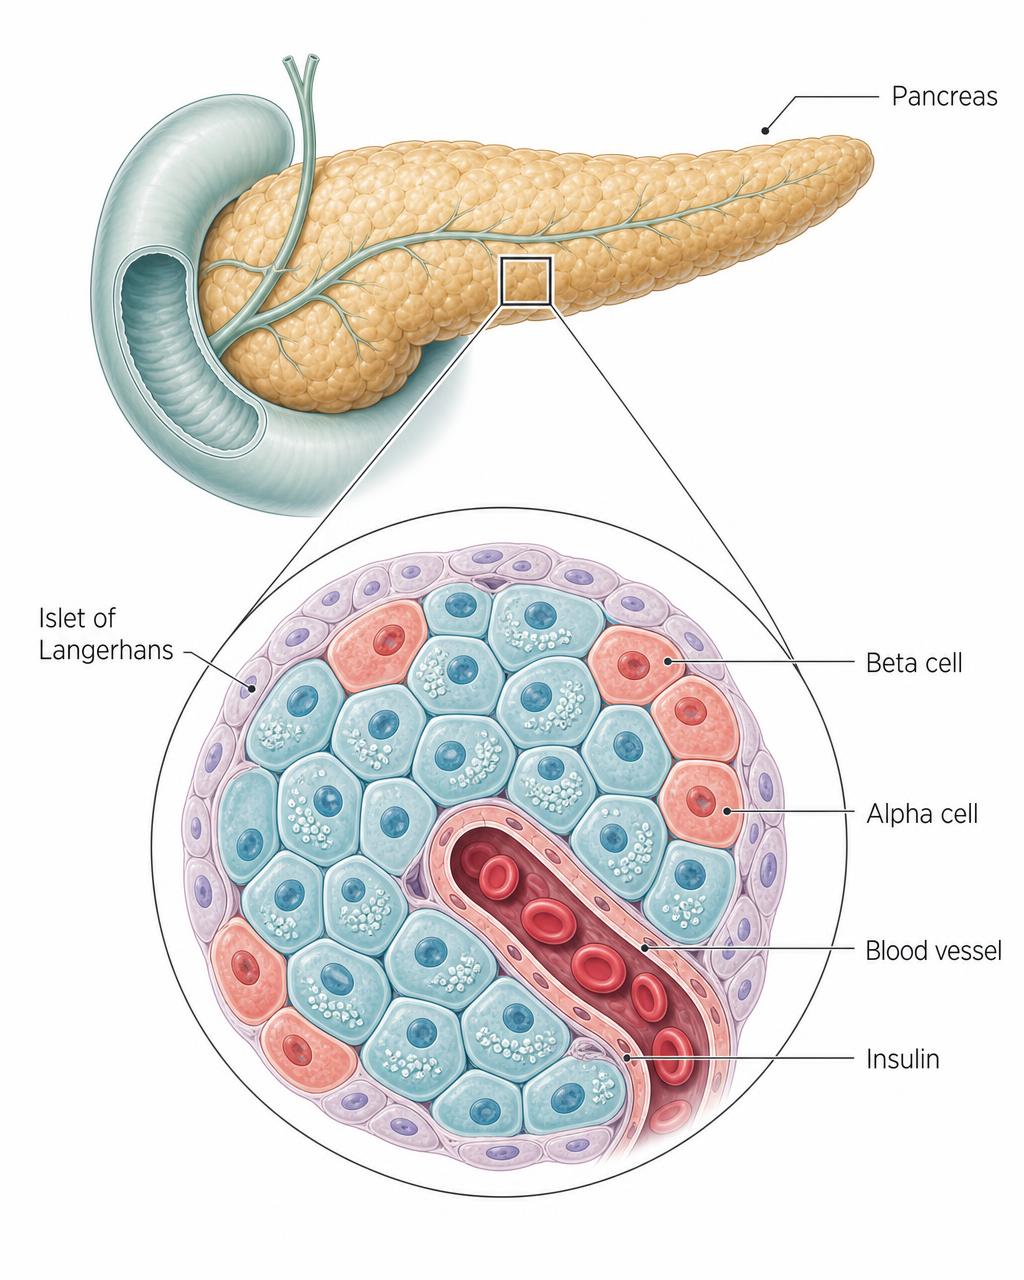
Autoimmune, inflammatory or metabolic pressures place increasing demands on the beta cell and disrupt normal cellular homeostasis.
Persistent stress may contribute to molecular damage, impaired cellular signaling and loss of normal beta-cell integrity.
Beta-cell function may decline through a combination of cellular dysfunction, loss of identity, exhaustion and cell death. The relative contribution of these processes differs across disease type and stage.
As functional beta-cell capacity declines, the pancreas may become less able to produce and secrete sufficient insulin for the body's needs.
Insufficient or inappropriate insulin responses contribute to abnormal glucose regulation, increasing glycemic variability and persistent hyperglycemia.
Progressive biological and functional changes ultimately contribute to the clinical presentation and complications of diabetes.
This continuum is conceptual. These biological processes may overlap, occur at different rates and vary substantially between individual patients.
Type 1 Diabetes — Autoimmune Pathway
In type 1 diabetes, immune activity is directed against pancreatic islet targets. Autoreactive immune cells contribute to progressive beta-cell injury and destruction, reducing the body's ability to produce insulin.
Conceptual sequence — Type 1 Diabetes
Genetic and Environmental Susceptibility
Islet Autoimmunity
Autoantibody Appearance and Immune Activation
Beta-Cell Injury and Destruction
Declining Endogenous Insulin Production
Clinical Type 1 Diabetes
Islet autoantibodies provide evidence of an immune response directed toward pancreatic islet targets and support T1D risk assessment and staging.
Autoantibodies provide evidence of autoimmunity but do not directly quantify the amount or rate of active beta-cell death.
Type 2 Diabetes — Metabolic Pathway
In type 2 diabetes, insulin resistance increases the demand placed on pancreatic beta cells. Beta cells may initially compensate by increasing insulin production, but persistent metabolic stress can contribute to progressive dysfunction and loss of functional capacity.
Conceptual sequence — Type 2 Diabetes
Insulin Resistance
Compensatory Insulin Demand
Chronic Metabolic Stress
Beta-Cell Dysfunction and Injury
Declining Functional Capacity
Prediabetes and Type 2 Diabetes
Muscle, liver and adipose tissues become less responsive to insulin, increasing the insulin required to maintain glucose regulation.
Type 2 diabetes involves both insulin resistance and beta-cell dysfunction. Beta-cell death is one component of a complex and heterogeneous disease process.
Pathway 1 — Type 1 Diabetes
Autoimmune pathway
Pathway 2 — Type 2 Diabetes
Metabolic pathway
Declining Functional Beta-Cell Capacity
Insufficient Insulin Response
Dysglycemia
Clinical Disease
T1D and T2D are biologically distinct diseases. In T1D, immune-mediated injury is the principal driver of beta-cell destruction. In T2D, insulin resistance and chronic metabolic stress contribute to progressive beta-cell dysfunction and failure.
Both pathways can ultimately result in insufficient functional beta-cell capacity, impaired insulin availability and dysglycemia.
Type 1 Diabetes
Type 2 Diabetes
C-peptide helps assess endogenous insulin production, while A1c and glucose measurements provide information about glycemic exposure and control. These measurements are essential, but they do not directly quantify the cellular injury occurring within the beta cell.
A molecular signal associated with beta-cell injury may provide complementary information about the biological process contributing to functional decline.
The Beta Intercept Program
Kihealth is developing Beta Intercept to measure circulating differentially unmethylated INS cfDNA — a molecular signal associated with pancreatic beta-cell injury and death.
Beta Intercept T1D is evaluating this signal in the context of autoimmunity, disease onset, residual beta-cell function and longitudinal progression.
Beta Intercept T2D is evaluating the signal across insulin resistance, prediabetes, type 2 diabetes and treatment-response research.
The objective is to determine whether direct molecular information about beta-cell injury can complement established measures of autoimmunity, insulin production and glycemic exposure.
The beta cell connects disease biology to clinical progression. In T1D, immune-mediated activity contributes to beta-cell destruction. In T2D, insulin resistance and metabolic stress contribute to beta-cell dysfunction and failure.
Beta Intercept is being developed to study the molecular signal associated with this central biological process.
Explore What Beta Intercept MeasuresThe Window of Opportunity
Traditional biomarkers move only after substantial, irreversible β-cell loss. Kihealth detects the molecular signature of active β-cell death years earlier — the first measurable sign of β-cell stress, inside the window where intervention still preserves function.
Conceptual biomarker trajectories
Illustrative — not derived from a single dataset
HbA1c and glucose often stay within the normal range while silent beta-cell injury is already underway.
Demethylated INS cfDNA rises as beta cells undergo apoptosis — a direct, earlier molecular signal.
Earlier detection opens the window to preserve functional beta-cell mass before substantial loss has occurred.
Interactive Disease Progression
Diabetes doesn't begin on the day it's diagnosed. Step through each phase to compare Kihealth's molecular signal against insulin, C-peptide, and traditional glycemic markers.
Apoptotic β-cells release tissue-specific, demethylated INS cfDNA fragments into circulation. Functional mass is still largely intact and both insulin and C-peptide remain within reference ranges.
Biological Signals
Kihealth Signal
Peak detection window — Beta Intercept™ signal is maximal.
Molecular signal precedes clinical diagnosis by years.
Biomarker Status at this Phase
Bar length = relative signal · illustrative
Active β-cell death at its height — the optimal detection window.
Output still within range despite ongoing injury.
Reserve capacity masks underlying loss.
No glycemic abnormality yet detectable.
Glucose tolerance preserved.
The Biology of Disease Onset
Both Type 1 and Type 2 diabetes begin as a cellular disease of the pancreatic β-cell. Long before fasting glucose or HbA1c cross clinical thresholds, β-cells are exposed to autoimmune attack, metabolic overload, chronic inflammation, and lipotoxicity that impair insulin secretion and eventually trigger apoptosis.
By the time hyperglycemia is measurable, the biological cascade has been active for years — and up to 50% of functional β-cell mass may already be lost. Conventional laboratory markers describe the endpoint of that process, not its onset.
Kihealth Labs was founded to measure the earlier chapters of that story: molecular evidence of active β-cell stress, injury, and death — the biology that precedes clinical disease.
The Beta-Cell Progression
Seven molecular stages define the trajectory from β-cell homeostasis to overt diabetes. Kihealth's diagnostics detect the earliest of these stages — inside the window where intervention still preserves function.
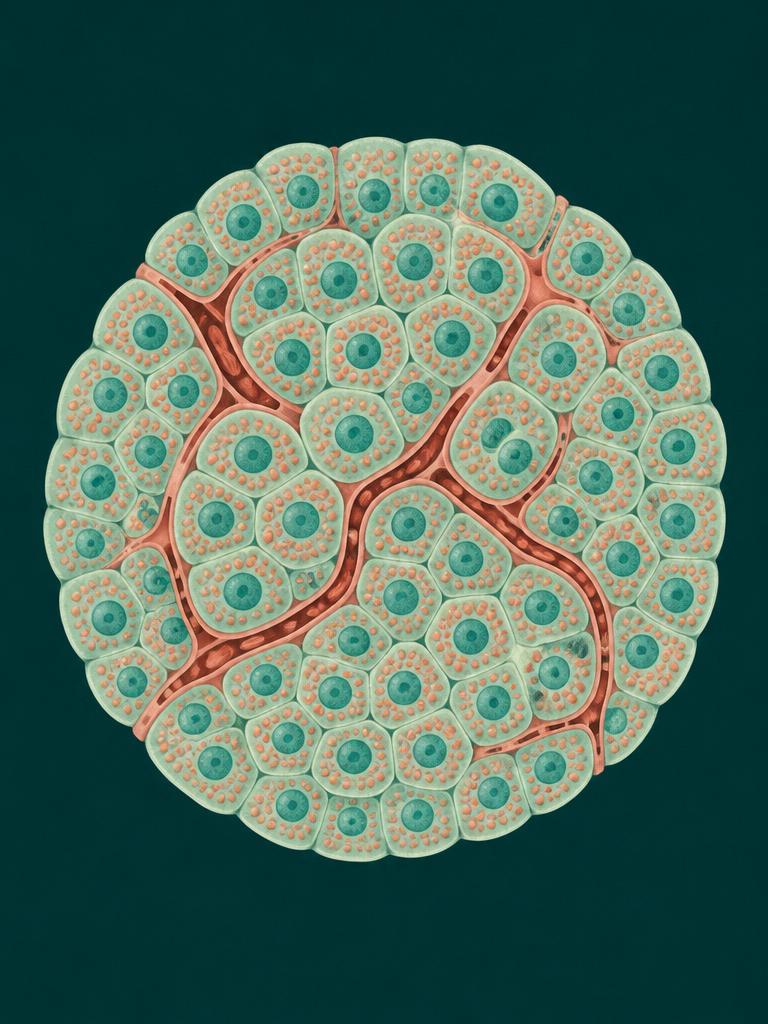
Islet β-cells maintain glucose homeostasis through tightly regulated, biphasic insulin secretion. Cellular architecture and mitochondrial function are intact.

Chronic hyperglycemia, hyperlipidemia, and increased secretory demand drive endoplasmic reticulum stress and mitochondrial dysfunction within the β-cell.
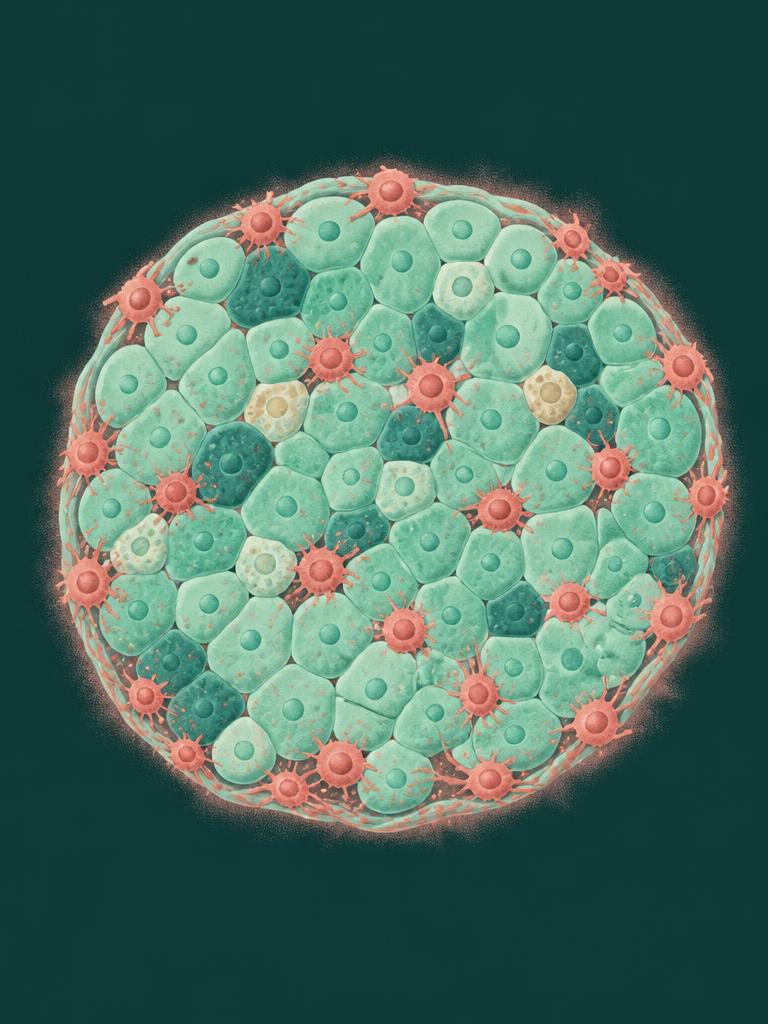
Islet-resident macrophages release IL-1β and TNF-α; in T1D, autoreactive T cells infiltrate the islet. Local cytokine signaling amplifies β-cell injury.
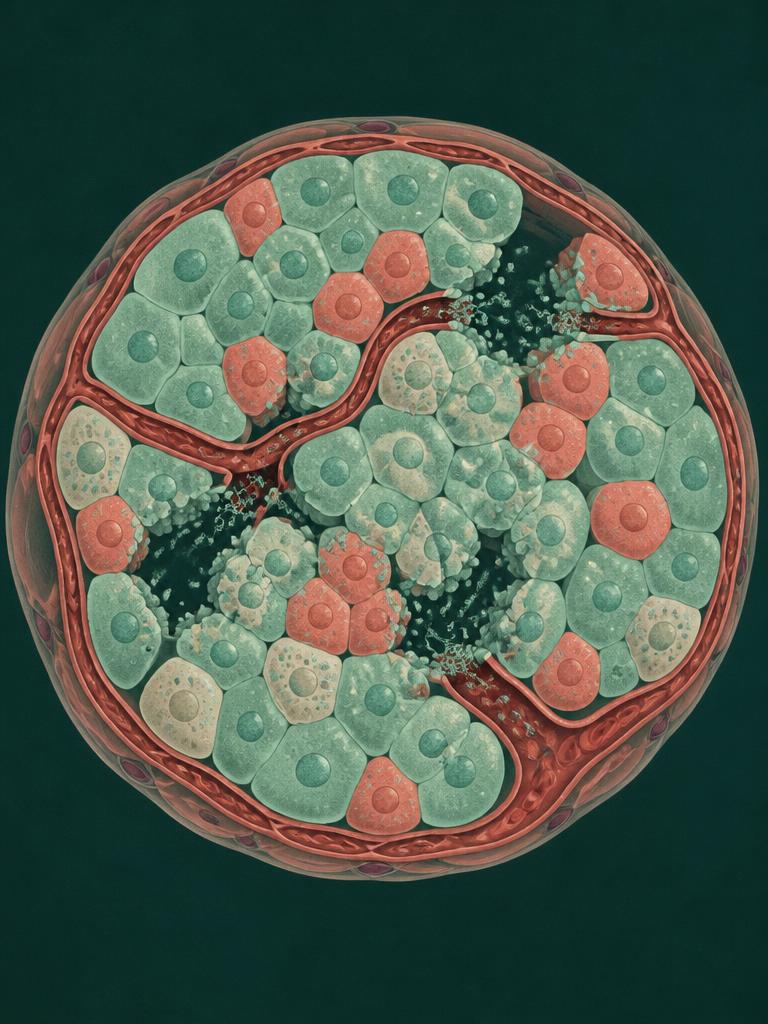
Injured β-cells undergo caspase-mediated programmed cell death, releasing fragmented, tissue-specific DNA into the peripheral circulation.
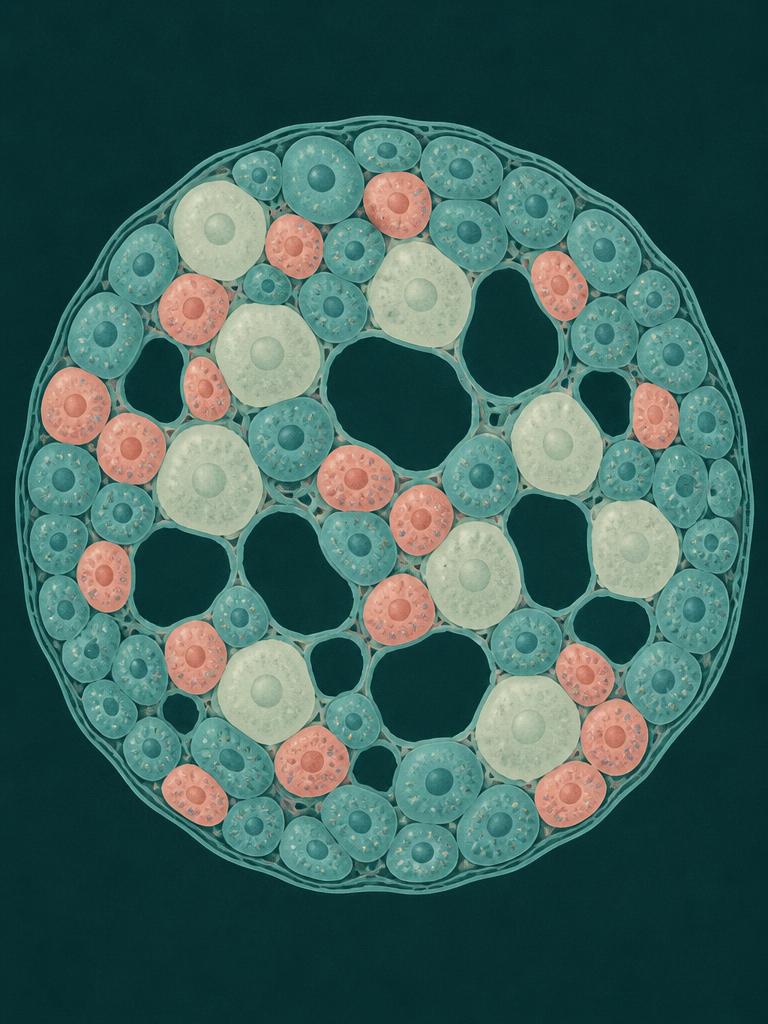
β-cell mass falls and remaining cells de-differentiate. First-phase insulin release is blunted before fasting glucose becomes abnormal.
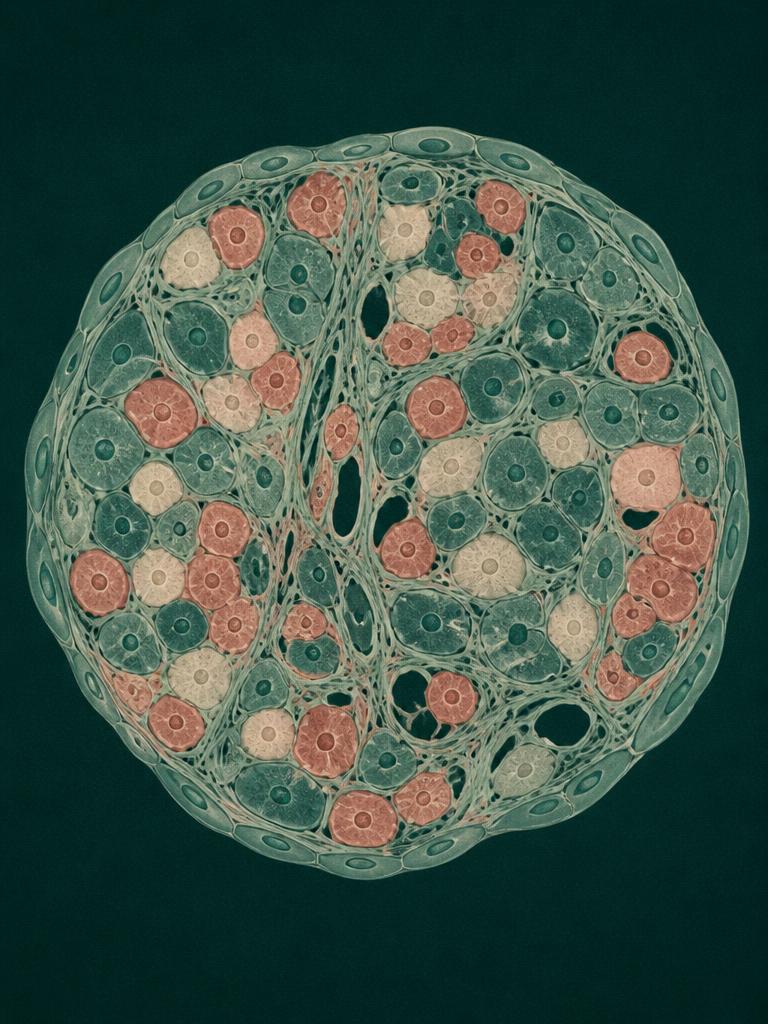
Impaired fasting glucose and impaired glucose tolerance emerge. HbA1c drifts into the 5.7–6.4% range; ~50% of β-cell function may already be lost.
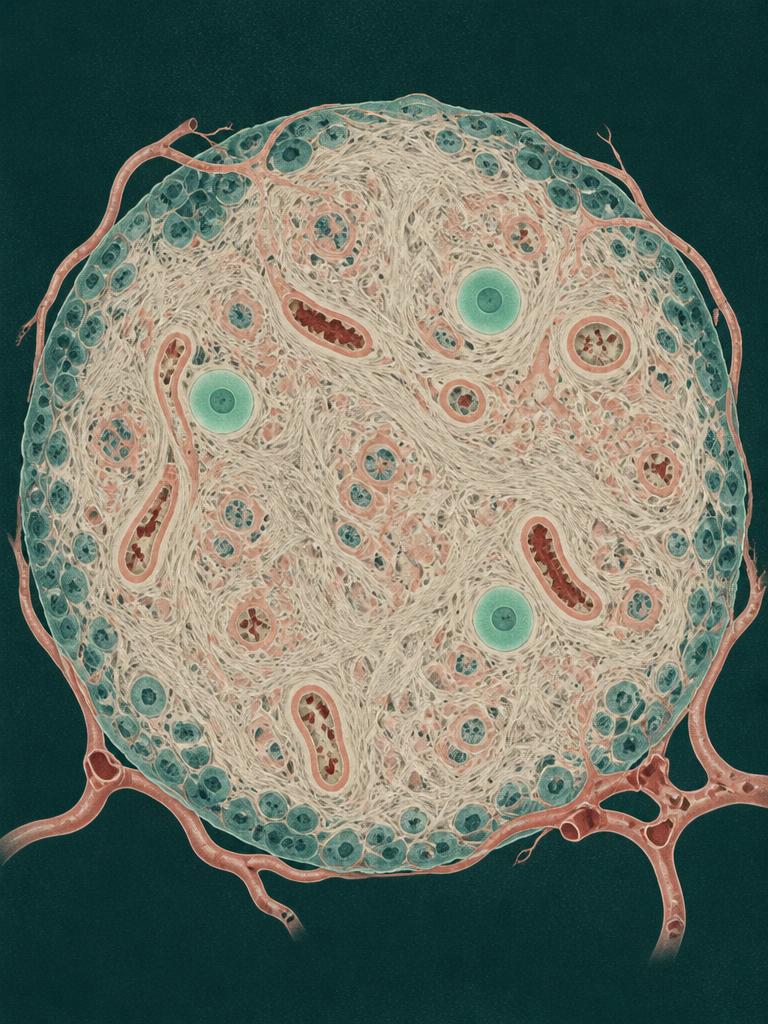
Clinical diagnosis by HbA1c ≥ 6.5%, fasting glucose ≥ 126 mg/dL, or symptomatic hyperglycemia. Microvascular complications have often begun.
What We Measure
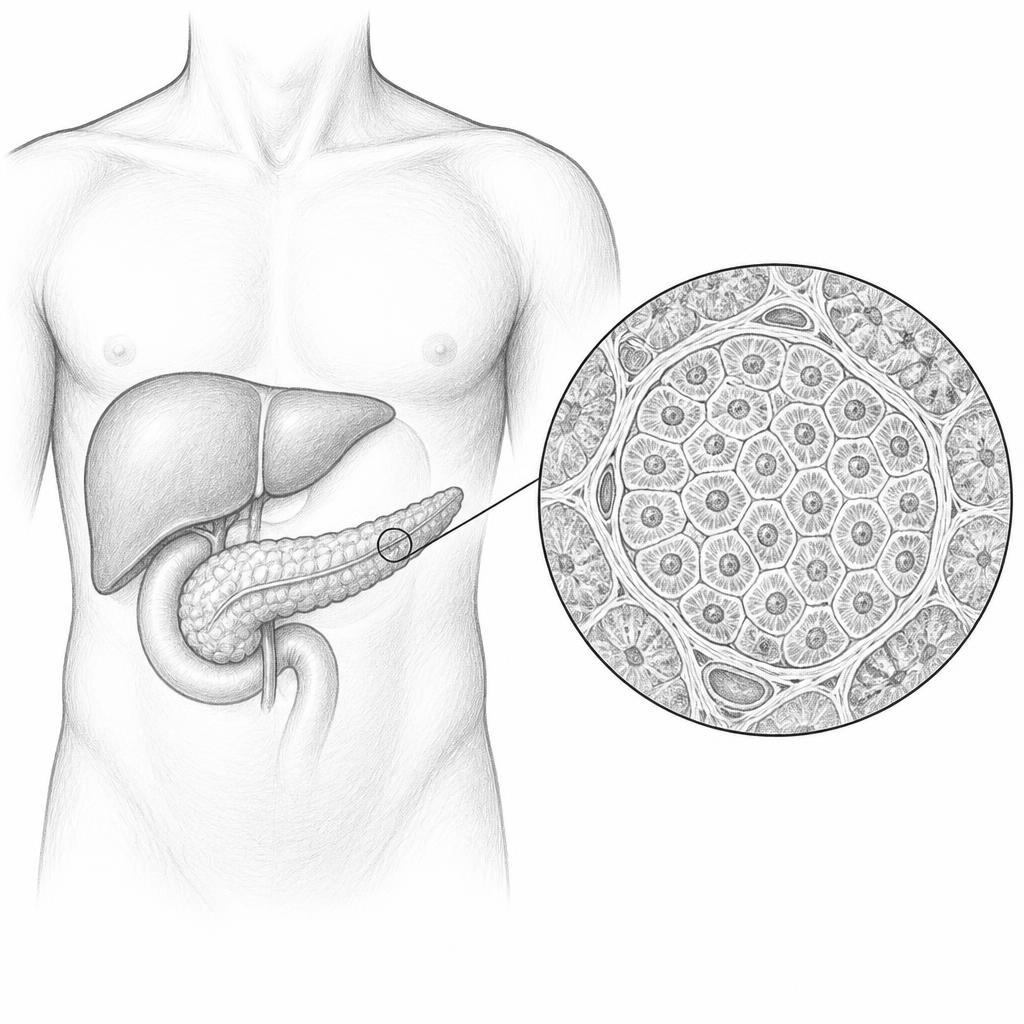
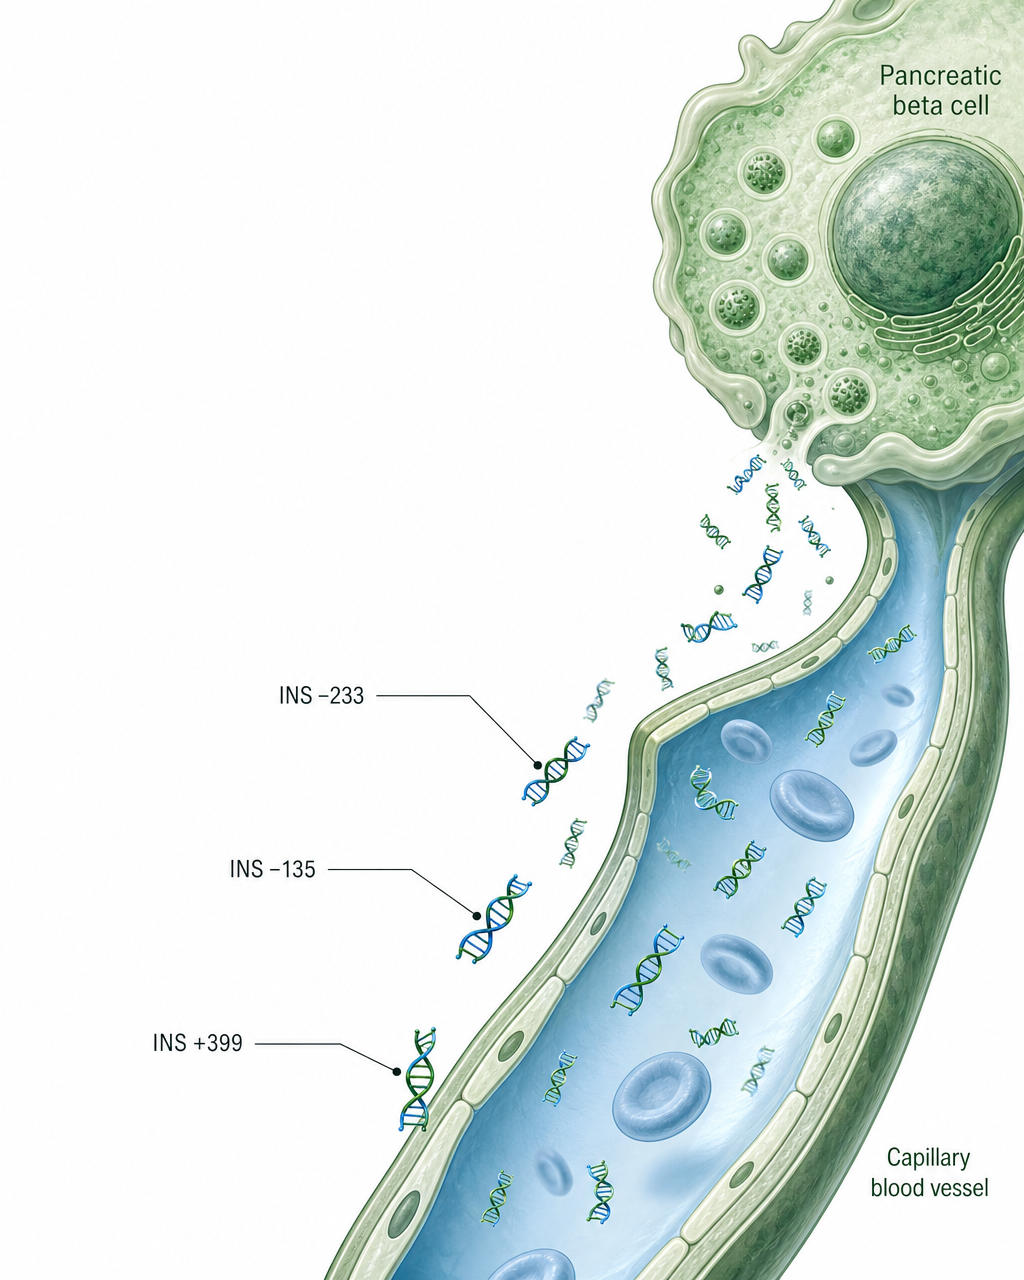
When pancreatic beta cells are damaged or destroyed, fragments of their DNA may be released into circulation as cell-free DNA. Because beta cells carry distinctive methylation patterns within specific regions of the insulin gene, these fragments can provide molecular information about their tissue of origin.
Kihealth measures differentially unmethylated INS cfDNA as a blood-based molecular signal associated with pancreatic beta-cell injury and death.
Autoimmune activity, metabolic stress and disease progression may contribute to beta-cell dysfunction, injury and death.
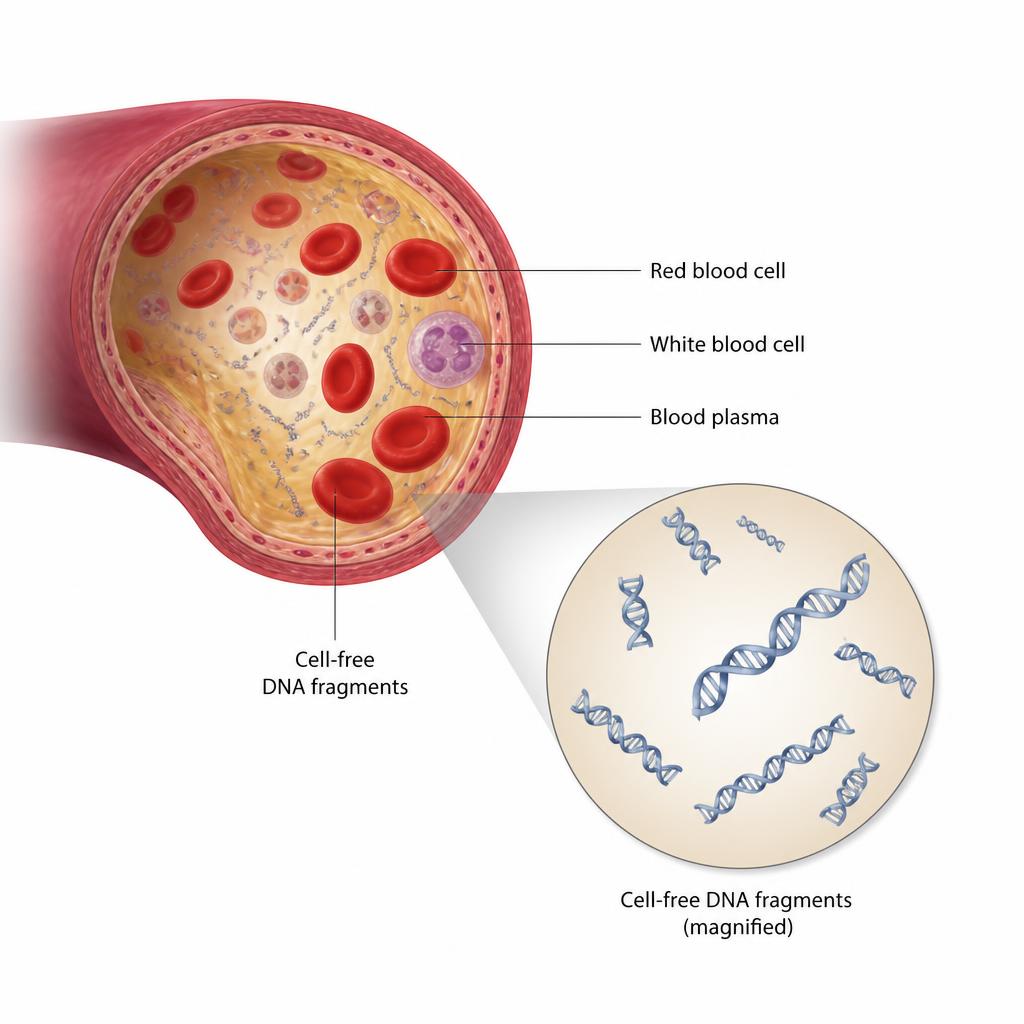
As beta cells are damaged or destroyed, small fragments of their DNA may enter the bloodstream as circulating cell-free DNA.
Specific INS gene regions carry methylation patterns associated with pancreatic beta cells, creating an opportunity to distinguish beta-cell-associated DNA within the broader pool of circulating cfDNA.
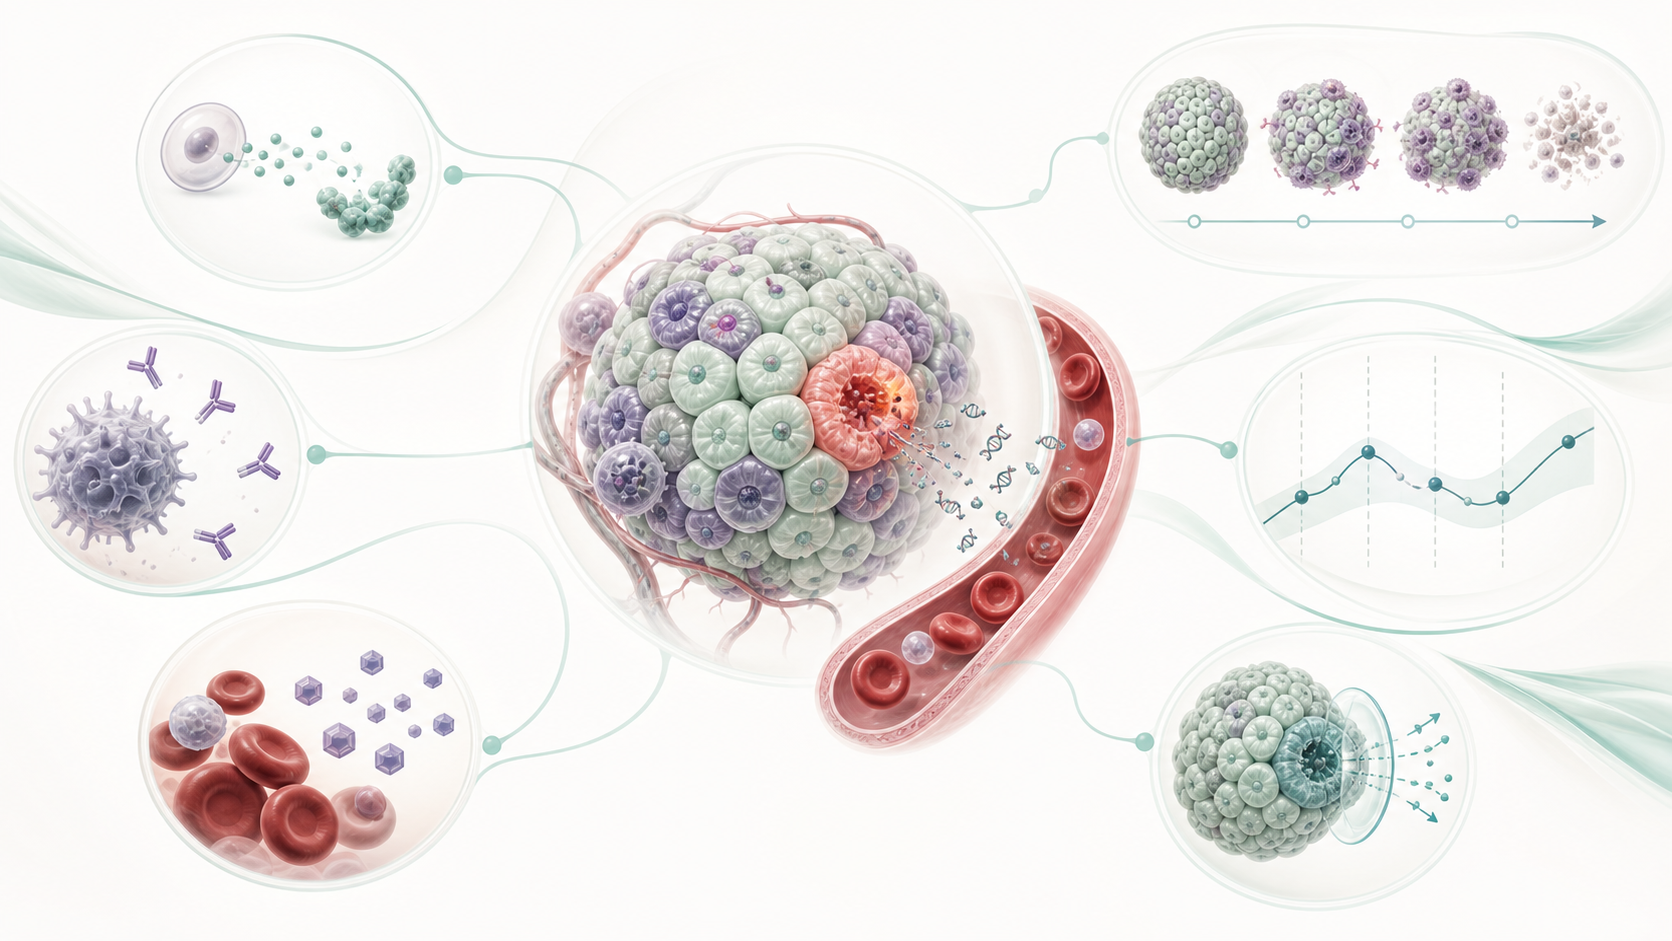
DNA methylation is an epigenetic modification that helps regulate gene activity. Although the underlying DNA sequence may be shared across tissues, methylation patterns can differ according to cell type.
Within pancreatic beta cells, selected regions of the INS gene demonstrate characteristic unmethylated patterns. Detecting these patterns within circulating cfDNA can provide evidence consistent with a beta-cell source.
The assay evaluates defined beta-cell-associated methylation regions. It does not assume that all circulating cfDNA originates from the pancreas.
Figure · INS Target Architecture
Chromosome 11 · schematic, not to scale
Kihealth evaluates INS −233, INS −135 and INS +399 together rather than relying on a single genomic region.
The multi-site approach is designed to provide a more robust view of the unmethylated INS cfDNA signal and reduce reliance on the behavior of any individual target.
Analytical Reference
LMO1 is measured as an intra-chromosomal reference target. It is located on chromosome 11, the same chromosome as INS, and supports normalization across the assay’s multiplex measurement.
LMO1 is used as an analytical reference. It is not interpreted as a biomarker of beta-cell injury.
compared and normalized with
Molecular Output
The resulting measurement represents the average percentage of unmethylated INS cfDNA detected across three evaluated genomic sites.
An increased molecular signal may be consistent with elevated beta-cell injury or turnover. The measurement should be interpreted within its intended use and alongside appropriate clinical and laboratory information.
The measurement is designed to provide information about a biological process that is different from the processes reflected by conventional diabetes biomarkers.
Provides information about glycemic exposure.
Provides information about endogenous insulin secretion and remaining beta-cell function.
Provide information about islet autoimmunity and T1D risk or stage.
Is being evaluated as a molecular signal associated with beta-cell injury and death.
Together, these measurements may provide a more complete view of disease biology than any individual biomarker alone.
Cell-Free DNA · Methylation
Cells can release small fragments of DNA into circulation during normal turnover, cellular stress, injury and death. These fragments are known as circulating cell-free DNA.
The biological value of cfDNA extends beyond its presence in the blood. Epigenetic patterns carried by each fragment can provide information about the tissue or cell type from which it originated.
Cell-free DNA provides the molecular material.
Methylation provides tissue-associated context.
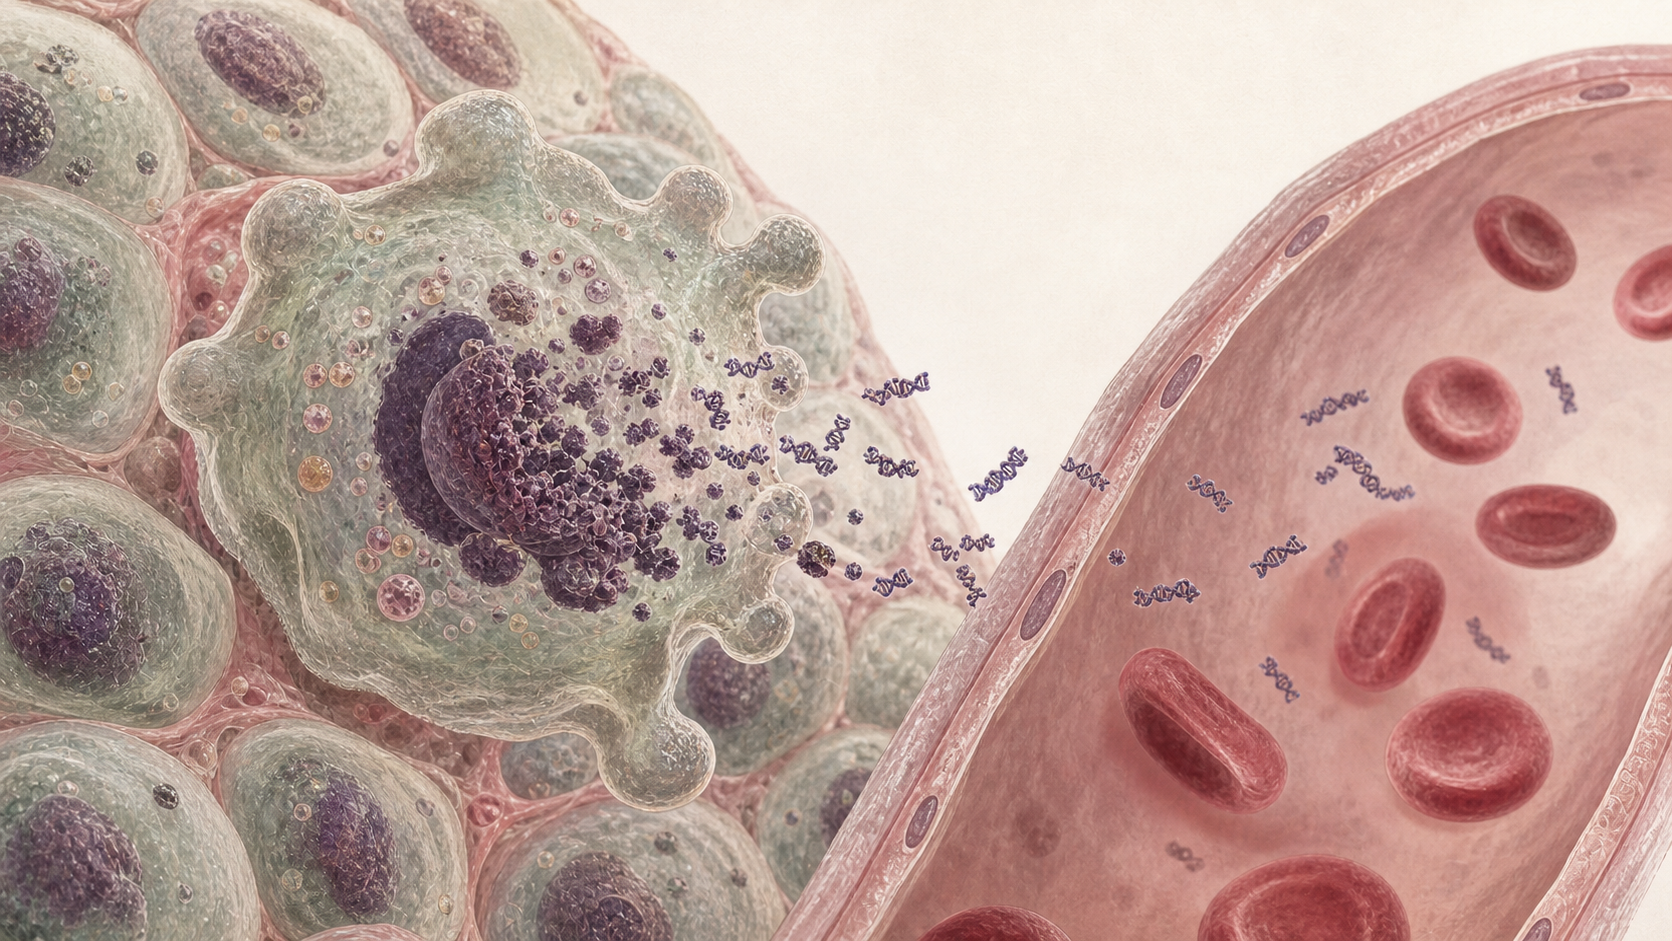
How the Signal Is Formed
A stressed cell releases DNA into blood; methylation patterns indicate which tissue the fragment likely came from.
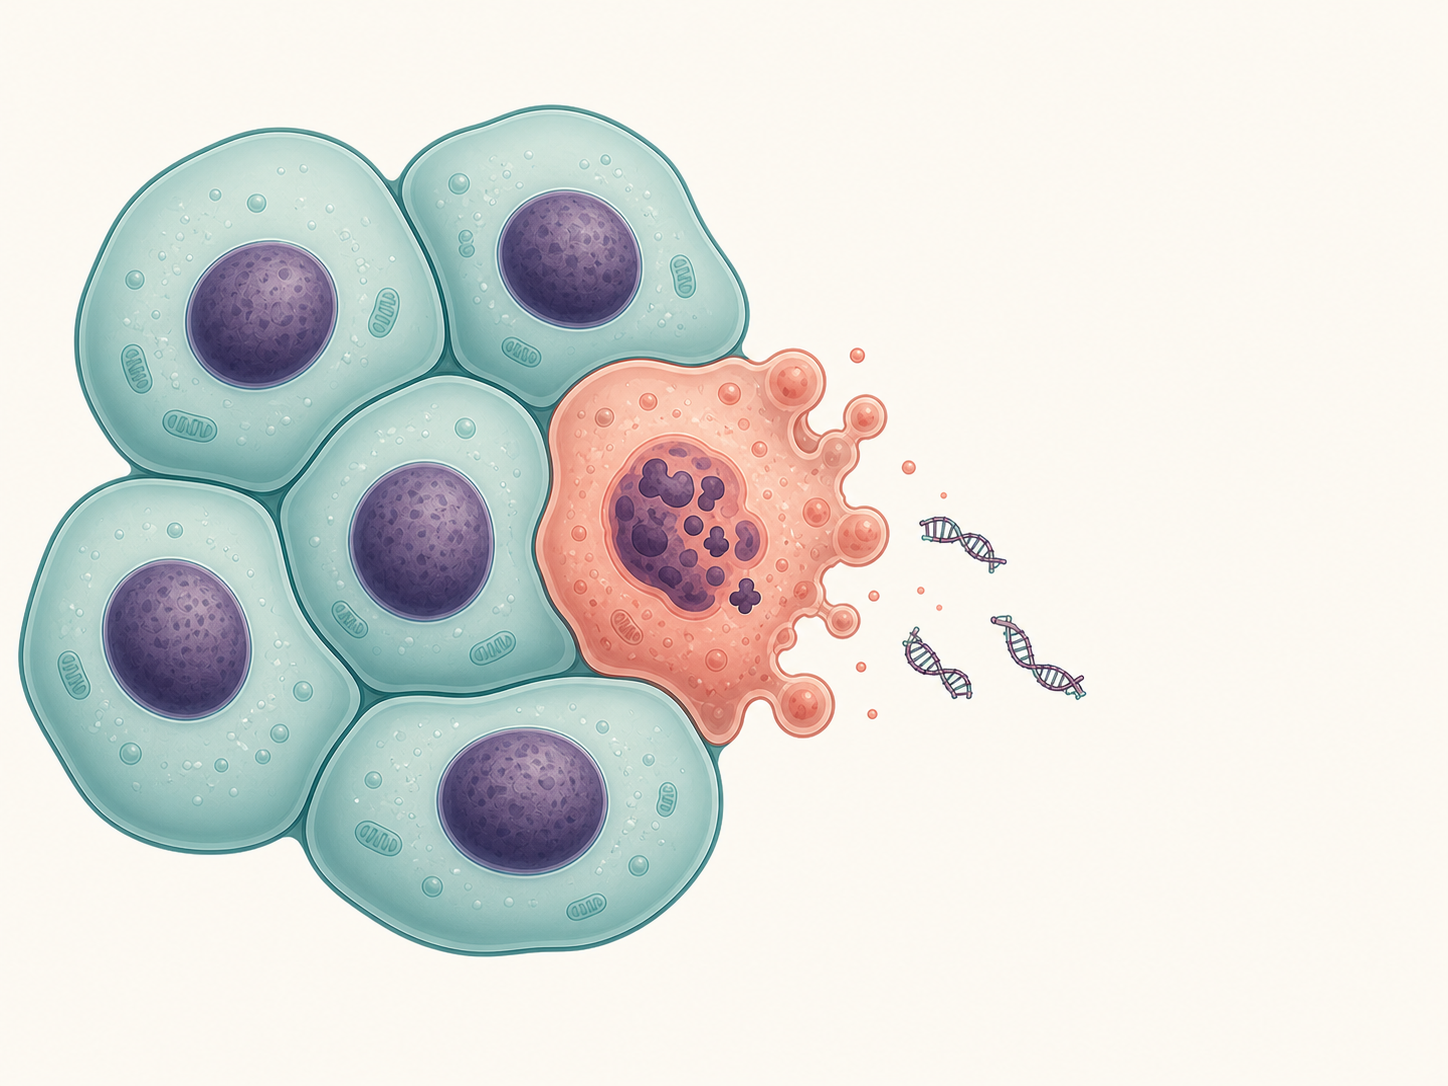
As cells are injured, die or turn over, short DNA fragments are released into the surrounding circulation.
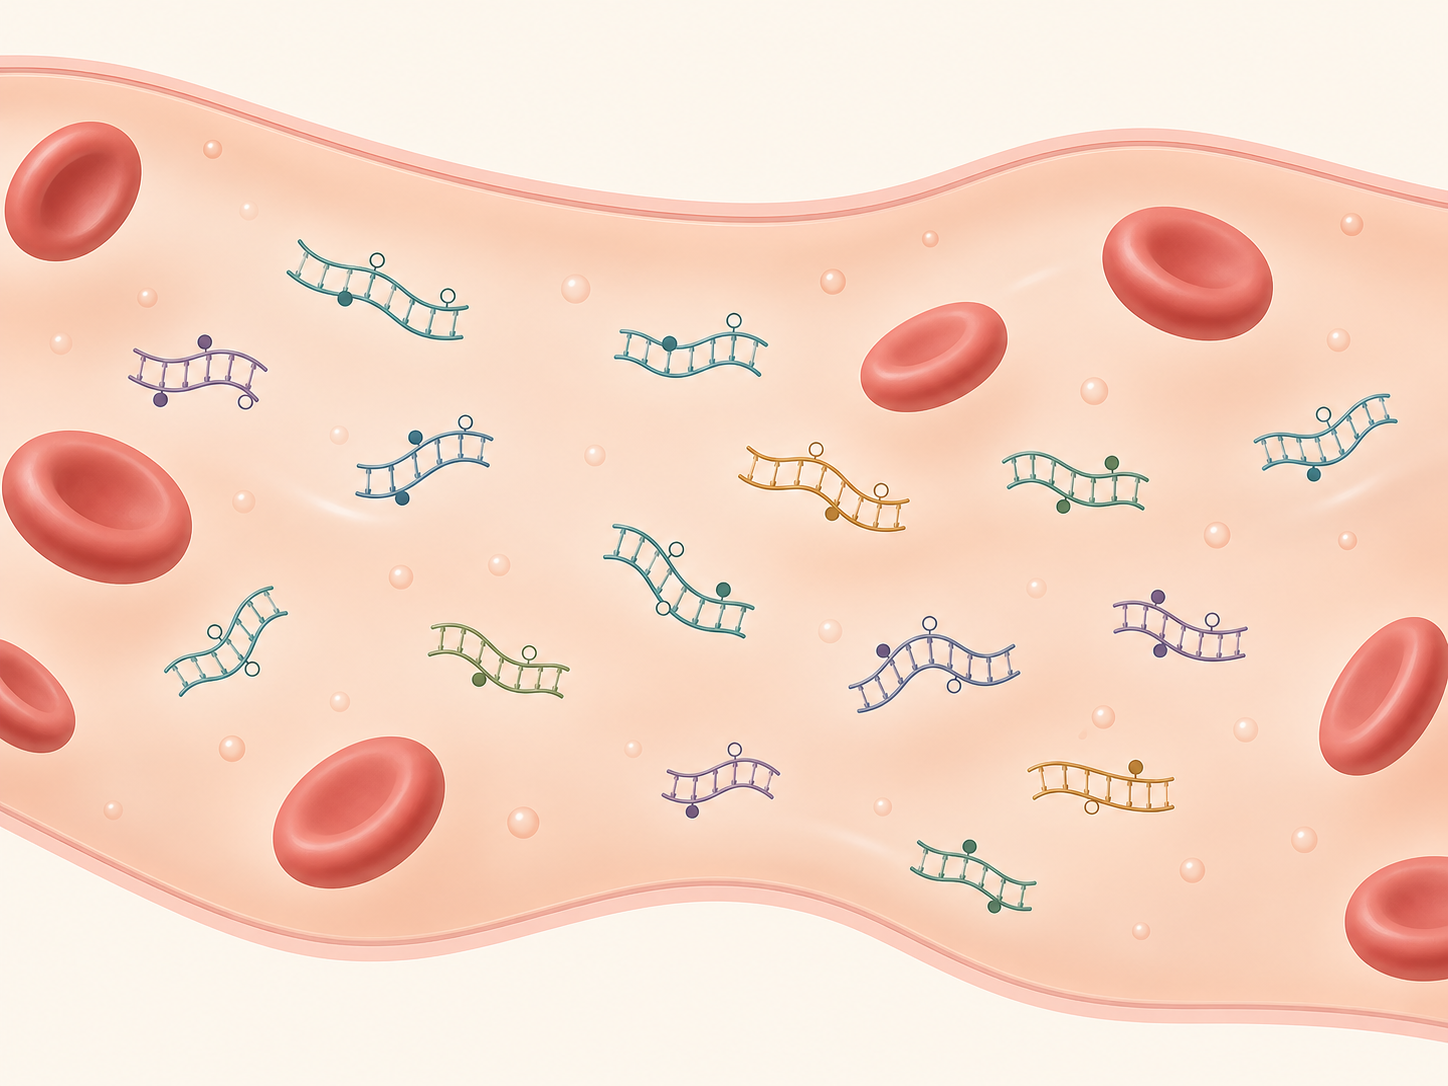
Plasma carries fragments from many tissues at once. Each fragment holds methylation marks at defined genomic sites.
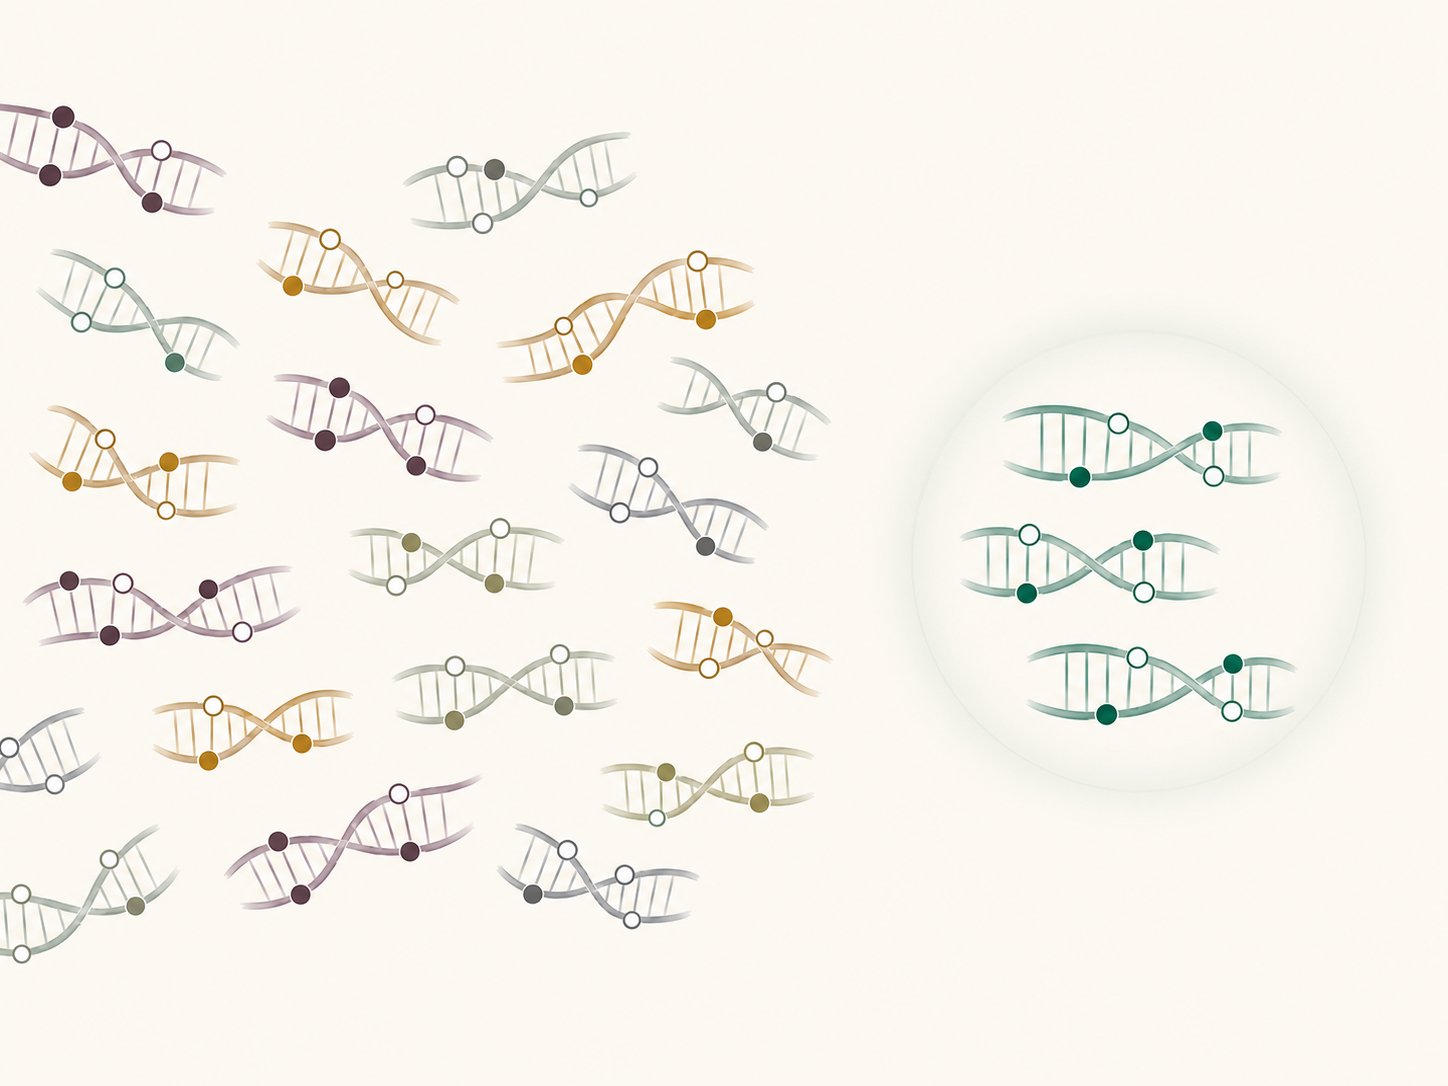
Fragments carrying an unmethylated beta-cell pattern can be distinguished from the broader circulating pool.
The Molecular Material
Circulating cell-free DNA consists of small DNA fragments found outside cells within blood plasma. These fragments can enter circulation as cells undergo normal turnover, stress, injury or death.
Because cfDNA is collected through a blood sample, it creates an opportunity to study biological processes occurring within tissues that may otherwise be difficult to observe directly.
DNA fragments may enter circulation as cells are injured, die or undergo normal biological turnover.
cfDNA can be isolated from the plasma component of a peripheral blood specimen.
The quantity and molecular characteristics of cfDNA may provide information about active biological processes occurring within the body.
The Tissue Context
DNA methylation is an epigenetic modification that helps regulate how genes are used without changing the underlying DNA sequence.
Different tissues and cell types can carry distinctive methylation patterns in selected genomic regions. These patterns can function as molecular signatures that help associate circulating DNA fragments with their probable tissue of origin.
Most cells contain essentially the same underlying DNA sequence.
Cells use different methylation patterns to regulate tissue-specific gene activity.
Selected methylation regions can help distinguish DNA associated with one cell type from the broader mixture of cfDNA in circulation.
The Integrated Scientific Model
By combining cfDNA measurement with tissue-associated methylation analysis, researchers can investigate not only whether cellular DNA is present in circulation, but also which biological source may have contributed to the signal.
Why This Matters for the Beta Cell
The pancreatic beta cell cannot be sampled routinely without an invasive procedure. Blood-based cfDNA analysis offers a noninvasive way to investigate molecular signals associated with beta-cell injury.
Within beta cells, selected regions of the INS gene carry characteristic unmethylated patterns. Detecting those patterns in circulating cfDNA creates an opportunity to study beta-cell injury through a peripheral blood specimen.
The Scientific Advantage
The signal is derived from molecular material released during cellular processes rather than solely from downstream metabolic consequences.
Methylation analysis helps connect circulating DNA with a probable cellular source.
Repeated blood collection may allow researchers to study how the molecular signal changes across disease progression or therapeutic intervention.
A1c, glucose, C-peptide and autoantibodies remain essential measures of glycemic exposure, metabolic status, endogenous insulin production and autoimmunity.
Cell-free DNA methylation analysis is being developed to provide a different layer of information: a molecular signal associated with tissue-specific cellular injury and death.
Key Takeaway
01Cell-free DNA carries fragments of biological activity through the bloodstream.
02Methylation patterns help reveal the tissue-associated origin of those fragments.
03Together, they create a foundation for studying active disease biology through a blood sample.
The Specimen
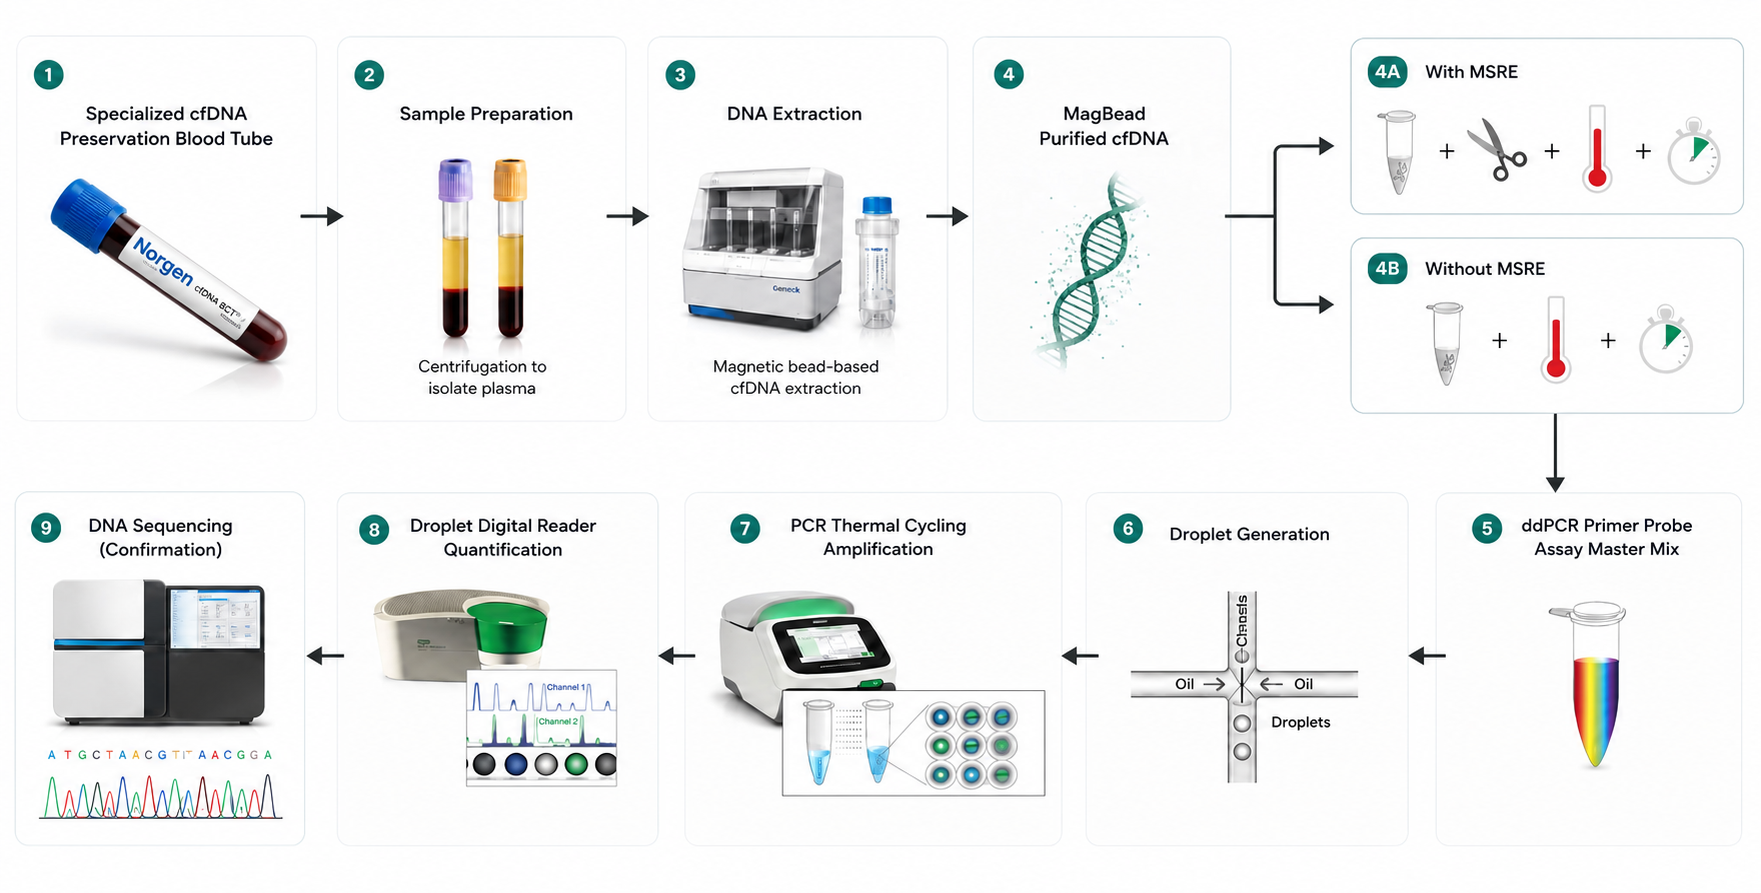
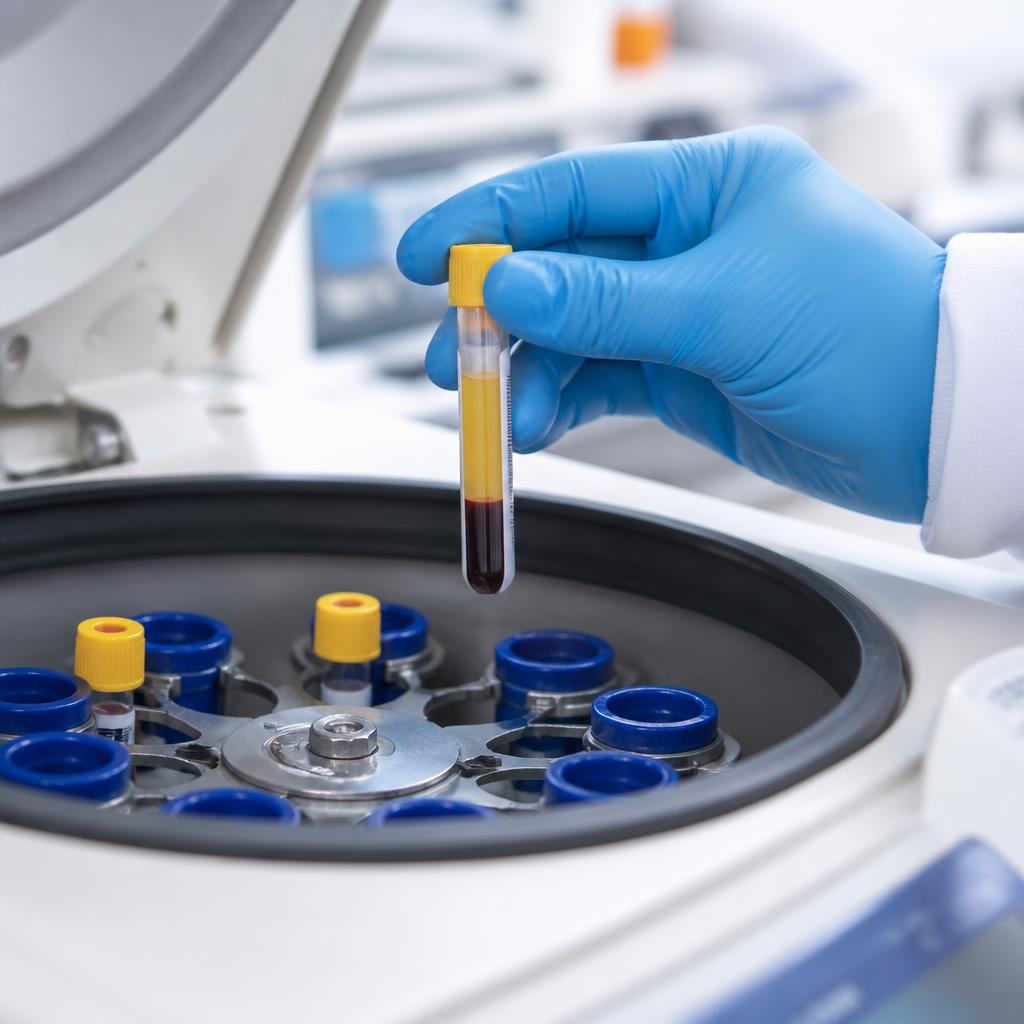
Beta Intercept begins with a standard venipuncture blood draw collected in a Norgen Biotek™ cf-DNA/cf-RNA Preservative Tube. The tube is designed to preserve circulating cell-free DNA during specimen transport and processing.
Following controlled centrifugation, plasma is separated from the cellular components of blood. A 500 µL plasma aliquot is then used for cfDNA extraction and molecular analysis.
Collection Device
Norgen Biotek™ cf-DNA/cf-RNA Preservative Tube
Preserves circulating cell-free DNA during specimen transport and processing, limiting background genomic DNA release from blood cells prior to plasma separation.
Venous whole blood is collected using a standard clinical blood-draw procedure.
The specimen is collected in a tube designed to stabilize circulating cfDNA and reduce changes that could affect downstream analysis.
Controlled processing separates plasma from blood cells and cellular debris.
A defined 500 µL plasma aliquot is used as the input for cfDNA isolation.
The extracted cfDNA advances into Kihealth’s liquid-biopsy and droplet digital PCR workflow.
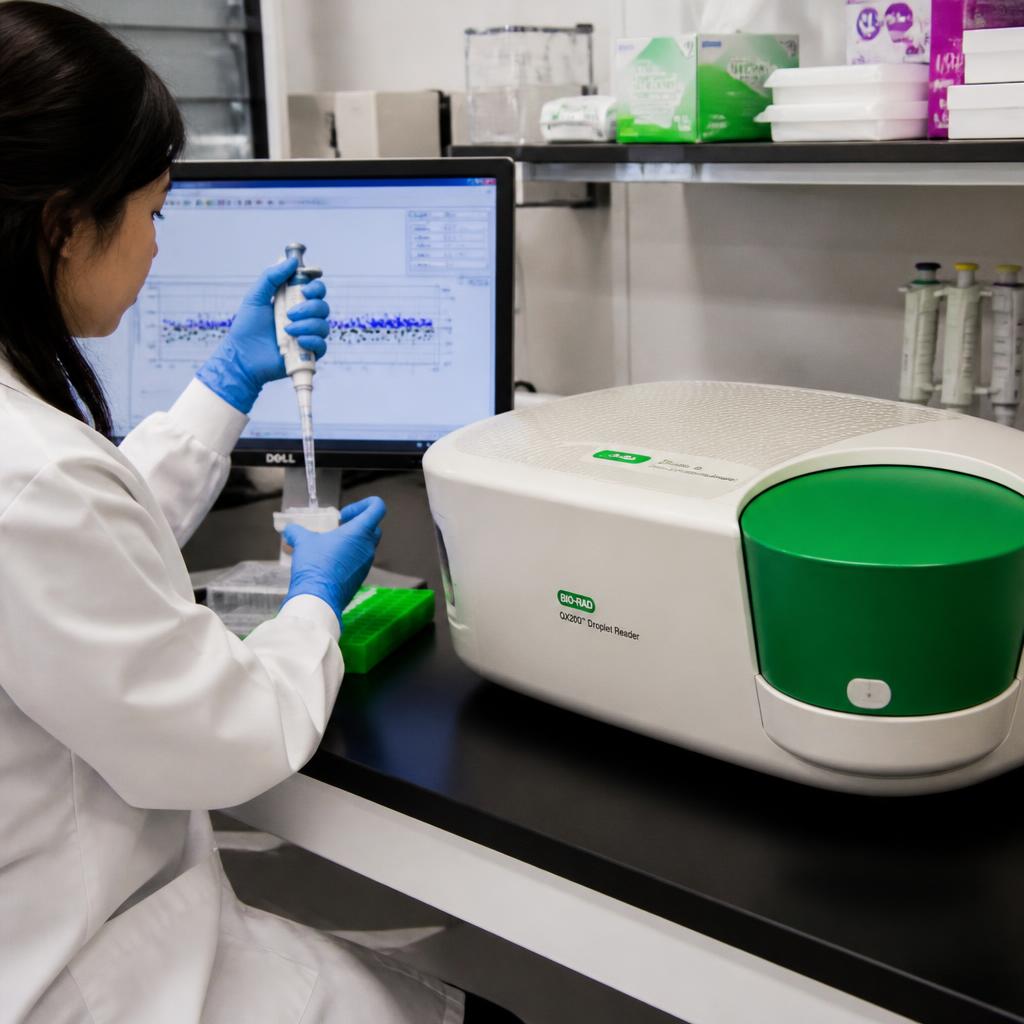
From a 500 µL plasma aliquot, Kihealth applies liquid-biopsy science and highly sensitive droplet digital PCR to measure beta-cell-associated INS cfDNA.
Liquid Biopsy
Liquid biopsy is the analysis of circulating molecular material — cfDNA, cell-free RNA, proteins, and extracellular vesicles — from a routine blood draw. Pioneered in oncology, it eliminates the anatomical and safety limits of tissue biopsy while providing a systemic view of disease biology.
For metabolic and autoimmune disease, liquid biopsy is uniquely powerful: pancreatic islets are inaccessible for routine sampling, and β-cell biology is otherwise measurable only by proxy. A plasma sample brings that biology into the diagnostic workflow.
Digital Droplet PCR
β-cell–derived cfDNA is exceptionally rare — often less than 0.1% of total plasma cfDNA. Detecting it reliably requires a technology with single-molecule sensitivity. Digital droplet PCR (ddPCR) partitions each reaction into tens of thousands of nanoliter droplets, enabling absolute quantification by Poisson statistics — without a standard curve, and with far greater precision than conventional qPCR.
Clinical Development Program — Beta Intercept
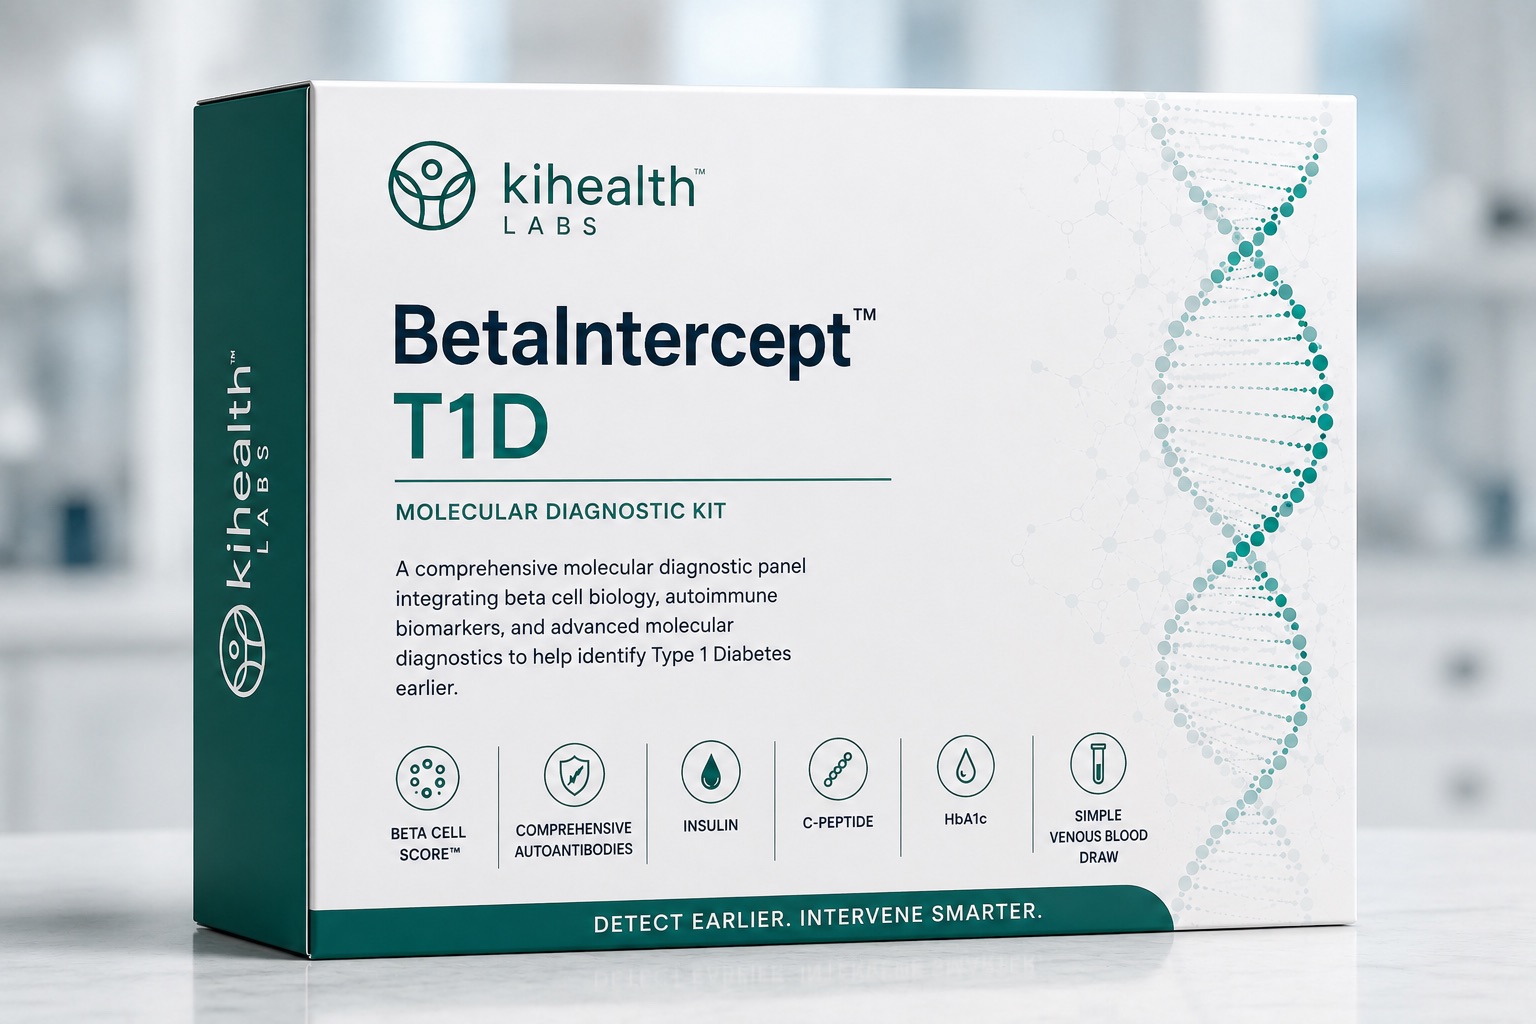
Beta Intercept is Kihealth's clinical-development program evaluating the measurement and interpretation of beta-cell-associated INS cell-free DNA across autoimmune and metabolic disease. The program is designed to investigate active beta-cell injury alongside established clinical measures and build evidence for potential diagnostic and treatment-response applications.
Investigating beta-cell injury across the type 1 diabetes continuum.
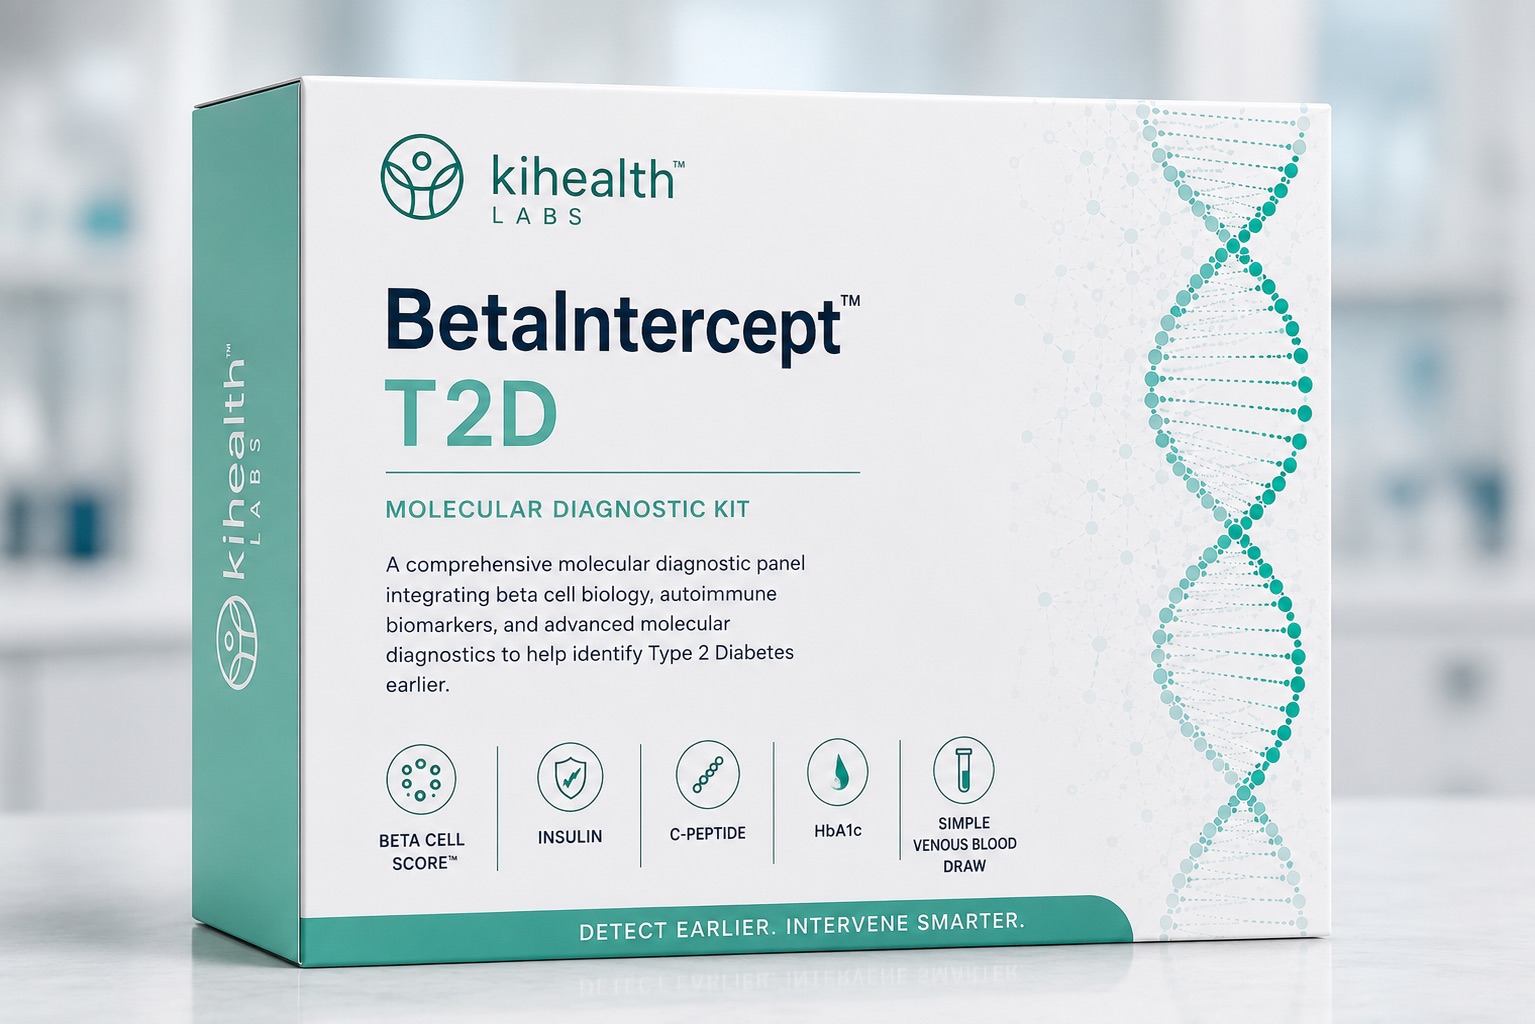
Studying beta-cell injury in metabolic dysfunction and type 2 diabetes.
Beta Intercept T1D and Beta Intercept T2D study distinct disease pathways through a shared biological lens: the health, injury and progressive loss of the pancreatic beta cell.
Intercept IQ™ Platform
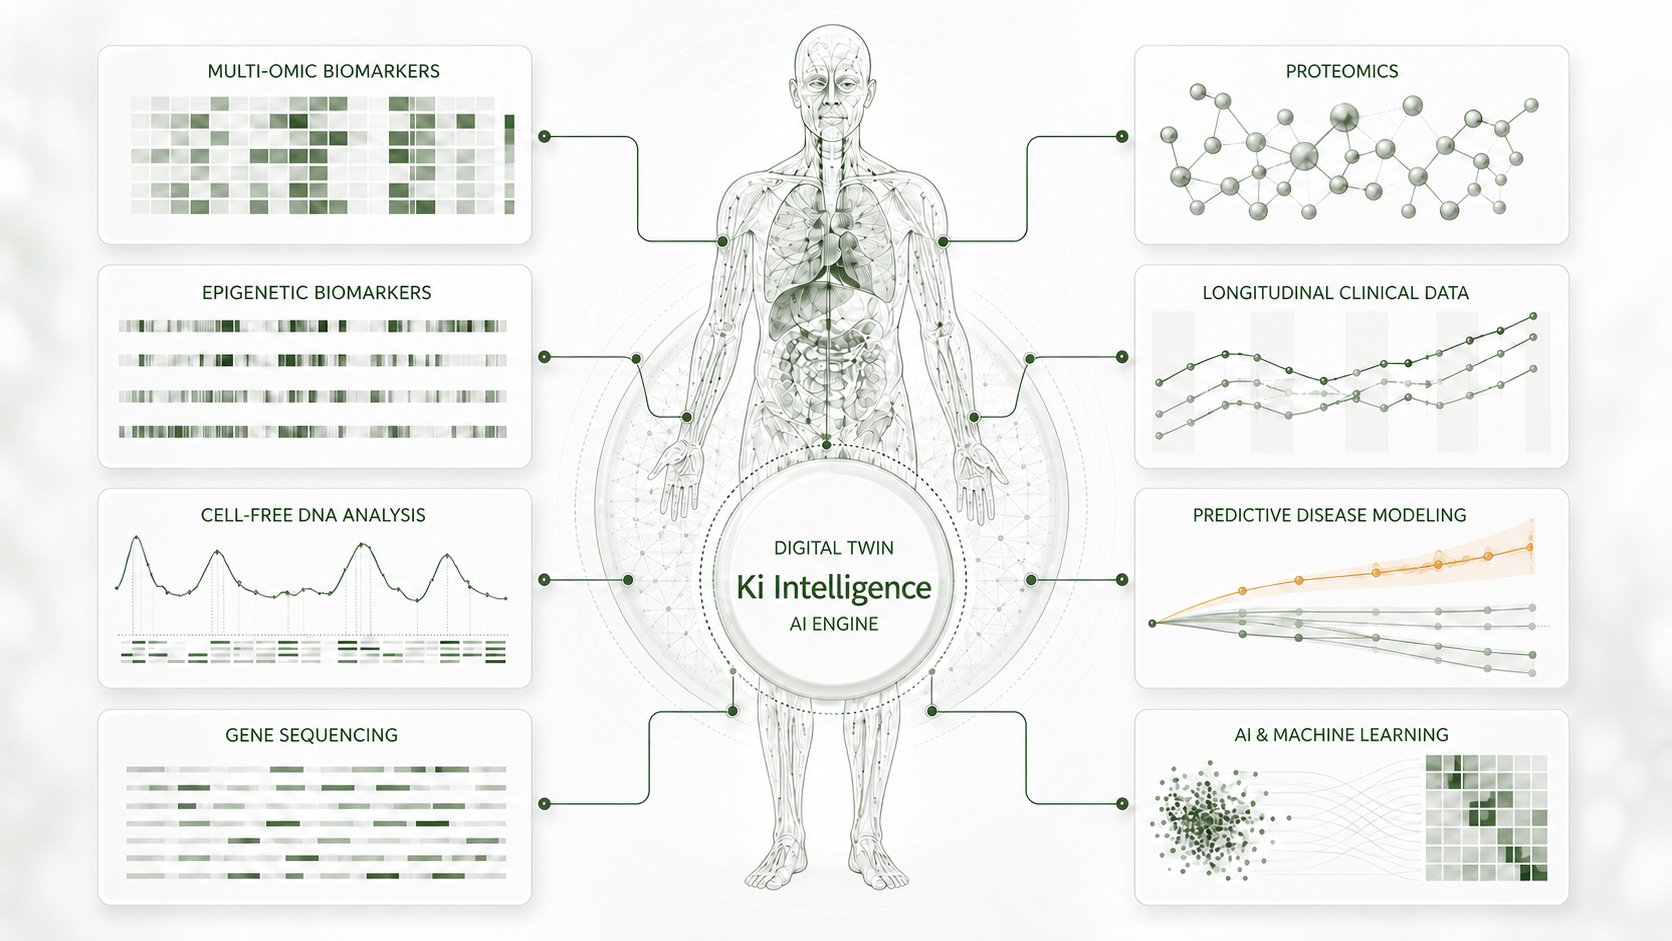
Intercept IQ is the platform every Beta Intercept diagnostic is built on. It brings together a true multi-omic foundation — gene sequencing, cfDNA methylation, proteomics, metabolic and biomarker data, preclinical evidence, longitudinal patient history and demographic and clinical context — inside a single analytical environment.
At its center is Ki Intelligence™, Kihealth's AI layer, which integrates those data streams into models and interpretations. Beta Intercept is the clinical-development program that generates evidence around beta-cell-associated INS cfDNA; the platform is what allows that signal — and future diagnostics — to be developed, validated and interpreted in biological context.
Beta-cell-associated INS cfDNA measurement evaluated across three genomic sites.
This measurement is the entry point into the platform — every downstream layer is anchored to it.
A true multi-omic approach: molecular, protein, metabolic, preclinical and longitudinal data are combined. Inputs vary by study and clinical setting; not every measure is used for every patient or research question.
The integrated analytical environment that unifies multi-omic, preclinical, clinical and longitudinal data into a single research-grade foundation — the foundation every Beta Intercept diagnostic is built on.
Kihealth's AI layer inside Intercept IQ — machine-learning methods for multi-omic integration, pattern recognition, risk-model development and longitudinal trajectory analysis.
Ki Intelligence operates inside Intercept IQ — not as a separate product.
Combines molecular and clinical information to support a more complete view of disease biology.
Supports the evaluation of biologically relevant subgroups within clinical and research populations.
Examines how molecular and clinical measurements change over time.
Supports the research and validation of models designed to characterize emerging or progressive disease risk.
Evaluates approaches for translating multimarker information into an interpretable research score.
Explores molecular and clinical changes associated with therapeutic intervention.
Because the data foundation and analytical core are shared, each new diagnostic inherits the same multi-omic infrastructure, validation methodology and interpretive models rather than starting from zero.
Beta-cell-associated INS cfDNA for autoimmune beta-cell stress and loss.
Beta-cell burden combined with metabolic and insulin-resistance context.
The same multi-omic architecture extends to additional tissue- and disease-specific programs.
Beta Intercept develops the clinical evidence surrounding the beta-cell molecular signal. Intercept IQ integrates that signal with broader clinical context. Ki Intelligence provides the analytical capabilities used to identify patterns, develop models and generate research insights.
Scientific Validation
Kihealth Labs advances its science through analytical validation, prospective and retrospective clinical studies, academic partnerships, and access to some of the most important longitudinal biobanks in diabetes research.

Laboratory Infrastructure
Kihealth Labs operates the specialized laboratory infrastructure required to translate emerging biomarker science into consistent, reproducible molecular measurements. Our integrated capabilities support the full workflow—from biospecimen processing and assay execution to quality review, data generation and clinical-development research.

Controlled receipt, accessioning and processing of blood and plasma specimens using defined handling and traceability procedures.
Specialized extraction, quality assessment and preparation methods designed for low-abundance circulating DNA.
Methylation-sensitive processing and multiplex droplet digital PCR workflows used to evaluate tissue-associated molecular signals.
Run-level controls, technical replicates, reference-target normalization and documented acceptance criteria support analytical consistency.
Laboratory measurements are reviewed and structured for use in clinical research, analytical validation and the Intercept IQ platform.
By connecting assay development, laboratory operations, quality systems and analytical infrastructure, Kihealth Labs can investigate complex molecular signals without the fragmentation that often slows diagnostic development.
Design, optimization and analytical evaluation of emerging molecular assays.
Sample processing and laboratory testing for retrospective, prospective and interventional studies.
Investigation of relationships between molecular measurements, disease biology and established clinical measures.
Standardized workflows and data systems designed to support expanding research and development programs.
Kihealth Labs provides the controlled environment, specialized molecular capabilities and quality systems required to advance Beta Intercept from biomarker research through analytical and clinical development.

Clinical Research Questions
A molecular measurement becomes clinically meaningful only when it is evaluated in the context of disease stage, established biomarkers and patient outcomes. The Beta Intercept clinical-development program is designed to investigate how beta-cell-associated INS cfDNA relates to autoimmune activity, metabolic dysfunction, beta-cell function and disease progression over time.
Evaluate whether changes in beta-cell-associated INS cfDNA may provide information about active cellular injury before major declines in insulin-producing capacity become apparent.
Characterize molecular changes before, during and after clinical diagnosis, including periods of rapid beta-cell loss and early disease progression.
Study the relationship between active beta-cell injury and remaining insulin secretory function across different disease stages and populations.
Examine beta-cell-associated INS cfDNA alongside autoantibody number, type and persistence to investigate complementary views of autoimmune risk and active tissue injury.
Evaluate the relationship between beta-cell injury, glycemic exposure and progressive metabolic dysfunction across the type 2 diabetes continuum.
Investigate whether repeated measurements reveal patterns of beta-cell injury that are not visible through a single clinical time point.
Explore whether molecular changes correspond with therapeutic intervention, beta-cell preservation or other clinically relevant measures of treatment response.
Evidence Development
Kihealth is advancing Beta Intercept through a structured evidence-development pathway—from biological rationale and analytical performance to clinical validation, clinical utility and regulatory development.
01
02
03
04
05
06
07
Established
Establish the scientific relationship between beta-cell injury, tissue-associated INS methylation and circulating cell-free DNA.
Completed
Evaluate the assay's accuracy, precision, analytical sensitivity, analytical specificity, quantitative range, recovery, stability and quality controls.
Ongoing
Characterize preliminary measurement distributions and reporting thresholds within an initial reference population.
2 studies
Pediatric T1D
Study beta-cell-associated INS cfDNA in relation to disease onset, autoantibody status, C-peptide and longitudinal beta-cell injury.
Adult Metabolic Disease
Evaluate the molecular signal across metabolic dysfunction, prediabetes and type 2 diabetes in relation to A1c, C-peptide and other metabolic measures.
Planned
Confirm analytical and clinical findings in additional cohorts, populations and research settings independent of initial development studies.
Ongoing
Investigate whether the measurement can provide meaningful information for defined clinical decisions, patient stratification, longitudinal monitoring or treatment-response assessment.
Planned
Develop the documentation, quality systems and supporting evidence required for clearly defined intended uses and potential regulatory pathways.
Biological Foundation
Established
Establish the scientific relationship between beta-cell injury, tissue-associated INS methylation and circulating cell-free DNA.
Analytical Performance
Completed
Evaluate the assay's accuracy, precision, analytical sensitivity, analytical specificity, quantitative range, recovery, stability and quality controls.
Reference-Range Development
Ongoing
Characterize preliminary measurement distributions and reporting thresholds within an initial reference population.
Clinical Validation
Pediatric T1D
Study beta-cell-associated INS cfDNA in relation to disease onset, autoantibody status, C-peptide and longitudinal beta-cell injury.
Adult Metabolic Disease
Evaluate the molecular signal across metabolic dysfunction, prediabetes and type 2 diabetes in relation to A1c, C-peptide and other metabolic measures.
Independent Confirmation
Planned
Confirm analytical and clinical findings in additional cohorts, populations and research settings independent of initial development studies.
Clinical Utility
Ongoing
Investigate whether the measurement can provide meaningful information for defined clinical decisions, patient stratification, longitudinal monitoring or treatment-response assessment.
Regulatory Development
Planned
Develop the documentation, quality systems and supporting evidence required for clearly defined intended uses and potential regulatory pathways.
Each stage addresses a different question: whether the biology is credible, whether the assay performs reliably, whether the signal is associated with relevant clinical characteristics and whether it can ultimately support a defined clinical use.