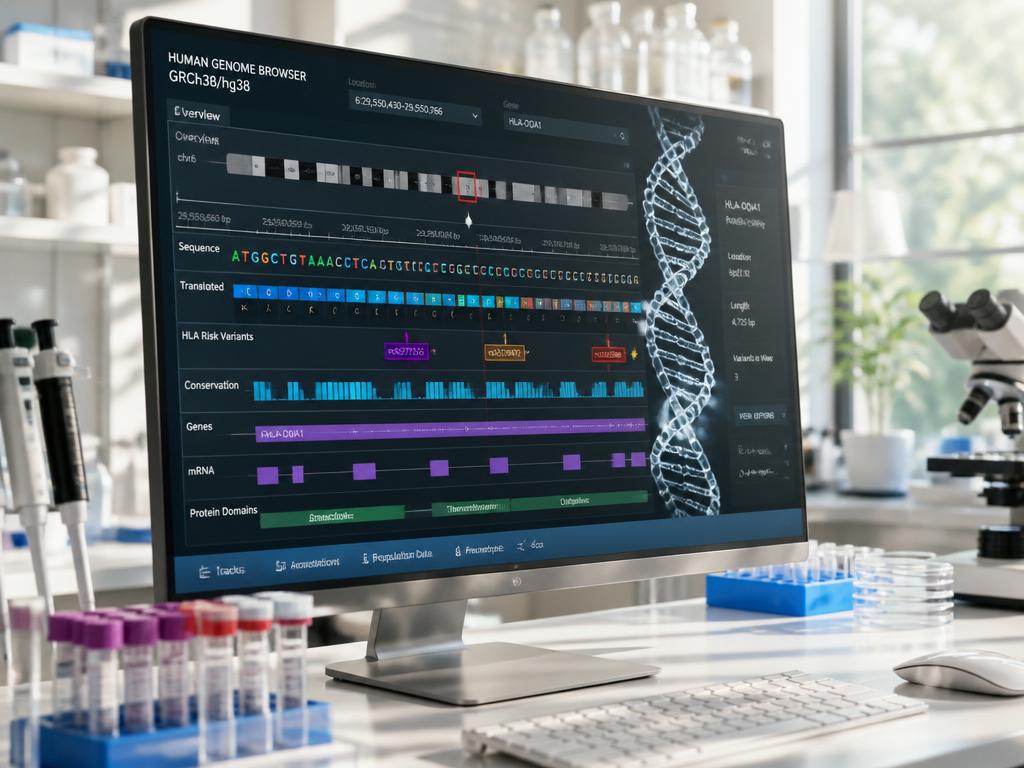
Detect Type 1 Diabetes Before Clinical Disease Begins.

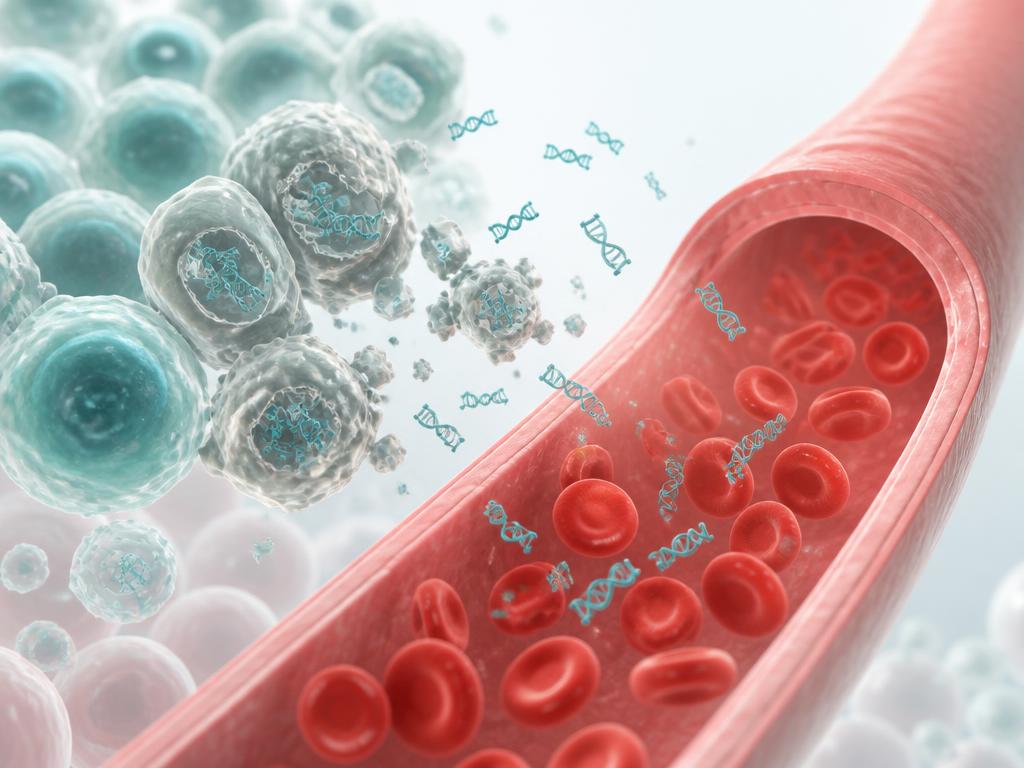
Beta Intercept™ T1D is a molecular liquid biopsy designed to identify active pancreatic beta-cell injury before irreversible loss of function occurs. Powered by the Intercept IQ™ Molecular Intelligence Platform — combining molecular biology, cell-free DNA, epigenetics, clinical biomarkers, artificial intelligence, and longitudinal data.

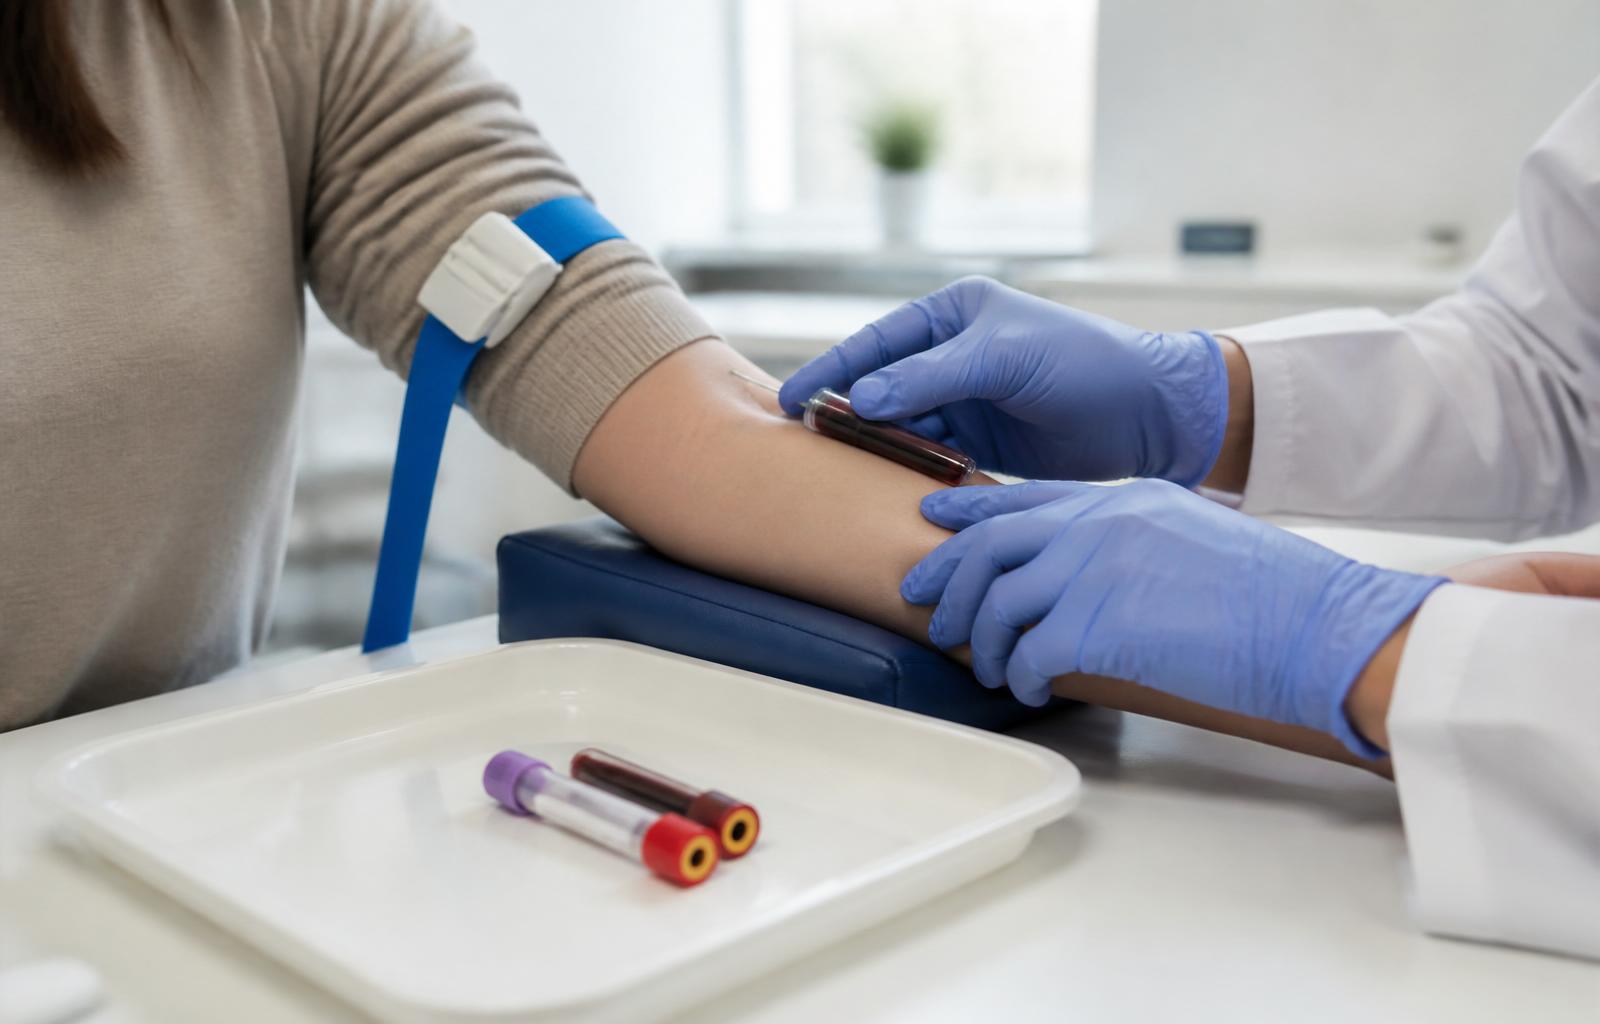
  • Beta-cell-derived cfDNA
  • Methylation-specific signal
  • Autoantibody integration
  • AI-driven interpretation
Clinician caring for a child at a pediatric diabetes clinic
Pediatric Focus
Built around families living with T1D risk.
Peripheral blood collection for a molecular liquid biopsy
Kihealth Labs high-complexity clinical laboratory
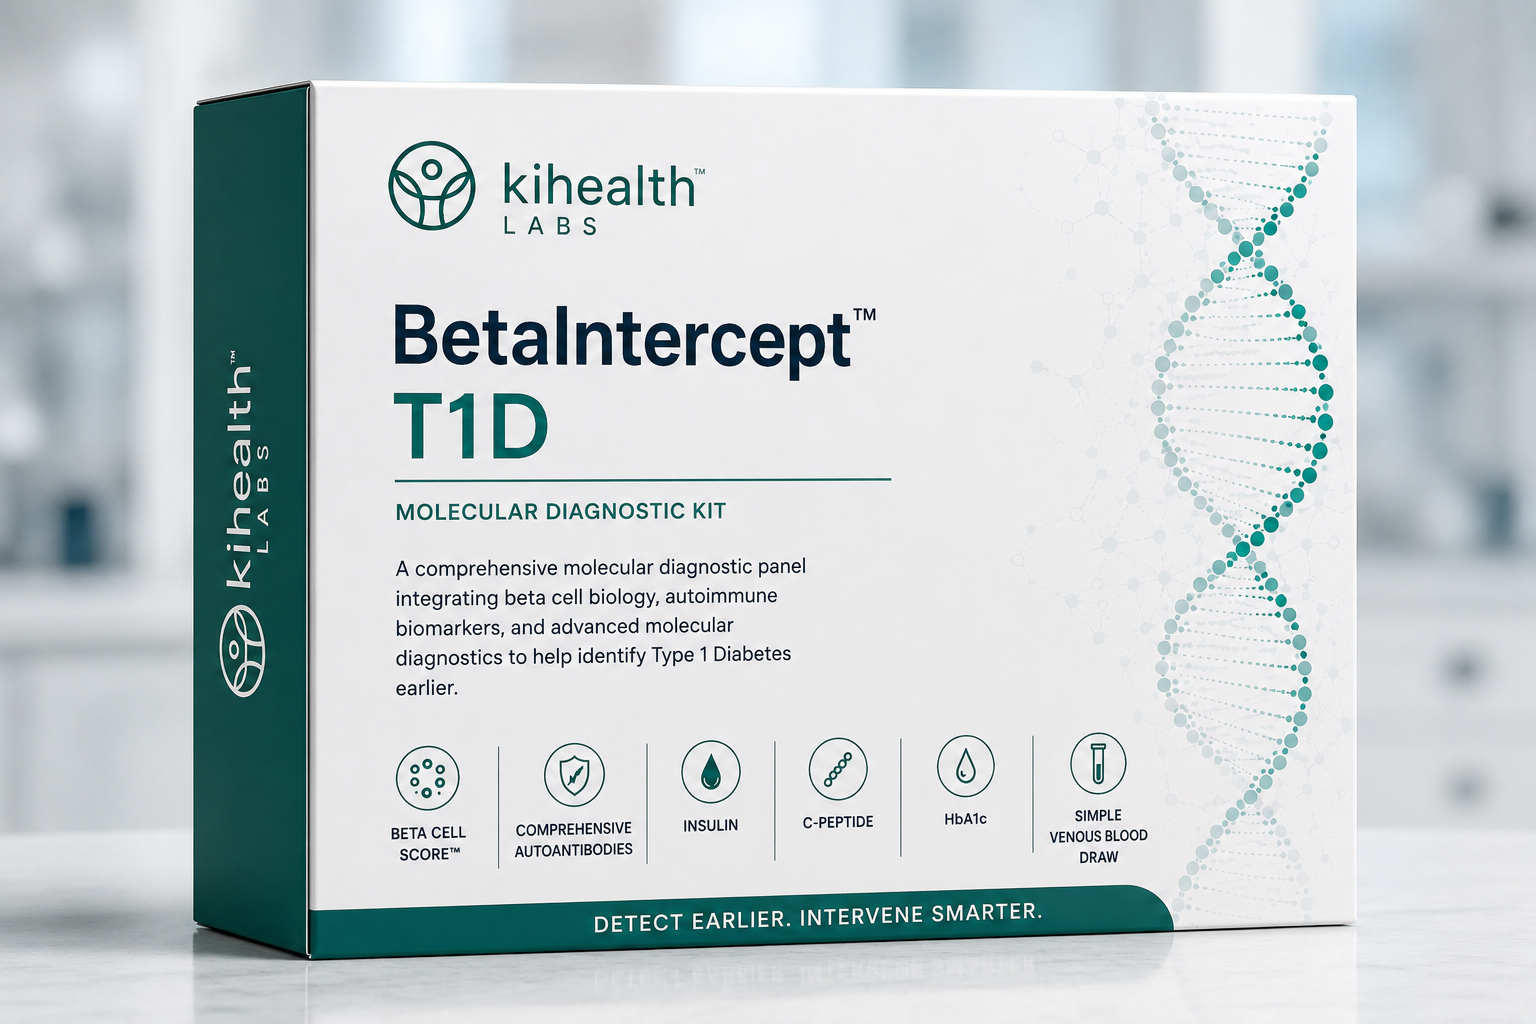
Beta Intercept T1D specimen collection kit
Sample
Peripheral blood
6 mL
Assay
Methylation-specific cfDNA + immunochemistry
Multi-modal
Turnaround
Sample to physician report
< 5 days
Setting
CLIA / CAP high-complexity laboratory
Regulated
THE UNMET NEED

Diagnosis today arrives after the biology has already failed.

Type 1 Diabetes is diagnosed after most beta cells are lost. Beta Intercept™ is designed to detect active biological changes years earlier — while intervention is still possible.

Stage 06
Autoantibody Development

Detectable seroconversion to GAD65, IA-2, ZnT8, IAA.

THE ASSAY

What Beta Intercept™ Measures.

A single blood draw delivers a molecular, biochemical, and immunological profile — unified by Intercept IQ™ into one interpretable disease signal.

Proprietary Signal
Beta Intercept™

Quantitative beta-cell-derived cell-free DNA. Measures active beta-cell apoptosis in real time — the earliest molecular signal of T1D biology.

Signal today
148
copies/mL
30-day Δ
+22%
rising
Baseline
< 20
reference

Figure — serial beta-cell cfDNA measurements for a representative case; illustrative.

Companion
HbA1c
%

Average glycemic exposure over ~90 days.

5.9+0.2
Companion
C-Peptide
ng/mL

Endogenous insulin production — surrogate for residual beta-cell reserve.

1.1−0.3
Companion
Insulin
µIU/mL

Current circulating insulin — real-time functional readout.

6.4−0.5
Immunology
Autoantibody Panel

Autoantibodies identify autoimmune activity. BetaDx™ measures beta-cell injury. Together they resolve the complete picture of disease biology.

GAD65
IA-2
ZnT8
Insulin Autoantibody (IAA)
Islet Cell Antibodies (ICA)
INTERCEPT IQ™ ARCHITECTURE

Powered by the Intercept IQ™ Molecular Intelligence Platform.

Fourteen tightly instrumented stages — from a single blood draw to a physician-facing report and a continuously learning intelligence layer.

01
Blood Collection

Single 6 mL draw at any CLIA collection site.

02
cfDNA Isolation

Proprietary low-input isolation preserves fragmentomic detail.

03
DNA Extraction

Cleanroom extraction protocol optimized for picogram inputs.

04
Epigenetic Analysis

Bisulfite conversion resolves beta-cell-specific methylation.

05
Digital PCR

Absolute quantitation of tissue-specific cfDNA copies.

06
Sequencing

High-coverage whole-genome methylation sequencing.

07
Clinical Biomarkers

HbA1c, C-Peptide, insulin, autoantibodies integrated.

08
Bioinformatics

Reproducible, HIPAA-compliant, containerized pipelines.

09
Artificial Intelligence

Multi-task Intercept IQ models jointly infer disease state.

10
Machine Learning

Federated learning across multi-institutional cohorts.

11
Clinical Interpretation

MD-signed report with molecular narrative.

12
Physician Report

HL7/FHIR delivery into the EHR.

13
Longitudinal Database

Every result feeds a de-identified evidence corpus.

14
Continuous Learning

Models improve with every outcome and validation study.

Sample to report
< 5 days
Median laboratory turnaround
Features per sample
2.4 M
Methylation, fragmentomic, end-motif
Cell types resolved
47
Tissue-of-origin atlas
MULTI-OMIC DISEASE INTELLIGENCE

Every biological system, one unified molecular profile.

Beta Intercept™ integrates orthogonal biological modalities. Each layer contributes independent evidence; Intercept IQ™ resolves them into a single disease signal.

Genomics
Germline & somatic variation
Epigenomics
Genome-wide methylation
Cell-Free DNA
Circulating apoptotic signal
DNA Methylation
Tissue-specific patterns
Transcriptomics
Cell-free RNA expression
Proteomics
Circulating protein signatures
Intercept IQ™Unified Signal
Immunomics
Autoantibody repertoire
Clinical Chemistry
Metabolic biomarkers
Demographics
Age, sex, ethnicity, HLA
Longitudinal Data
Serial biological trajectory
Therapeutic Response
Pharmacodynamic outcomes
Current commercial capability Planned platform module
PRECLINICAL SCIENCE

The biology begins long before the diagnosis.

Beta Intercept™ operates in the pre-clinical window — where measurable molecular events precede autoantibody seroconversion and glycemic dysregulation.
Stage 1 of Type 1 Diabetes disease development — Genetic susceptibility
01
At risk
Genetic susceptibility
HLA class II and polygenic risk are established at birth.
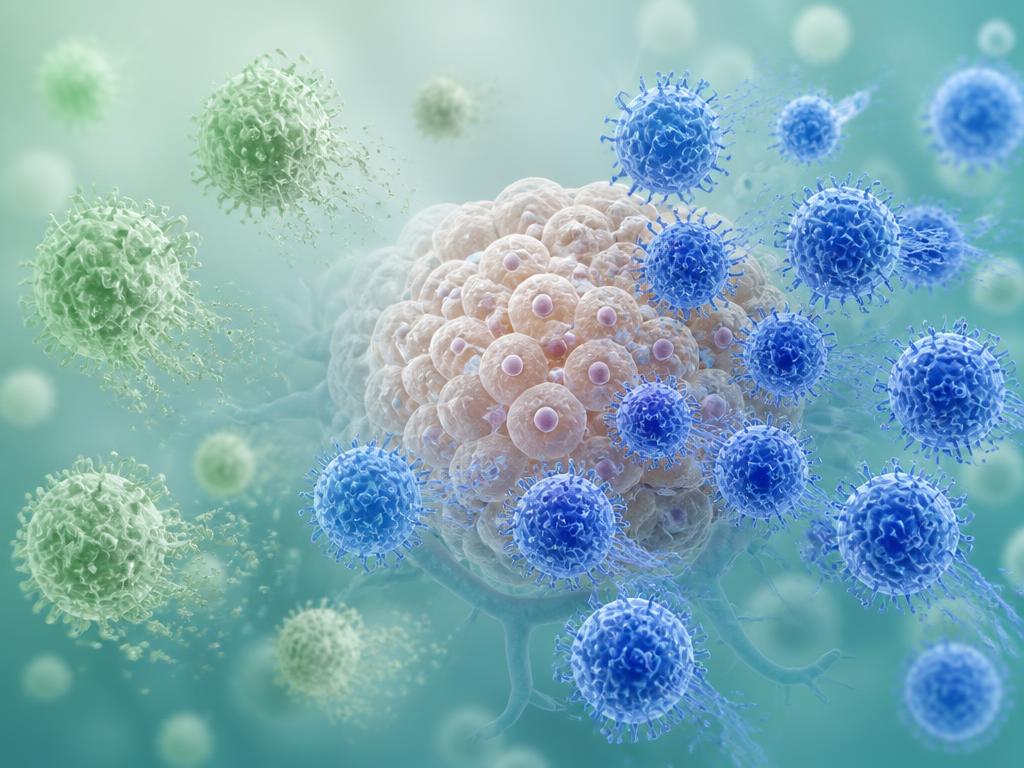
Stage 2 of Type 1 Diabetes disease development — Loss of immune tolerance
02
At risk
Loss of immune tolerance
Regulatory T-cell dysfunction; autoreactive clones emerge.
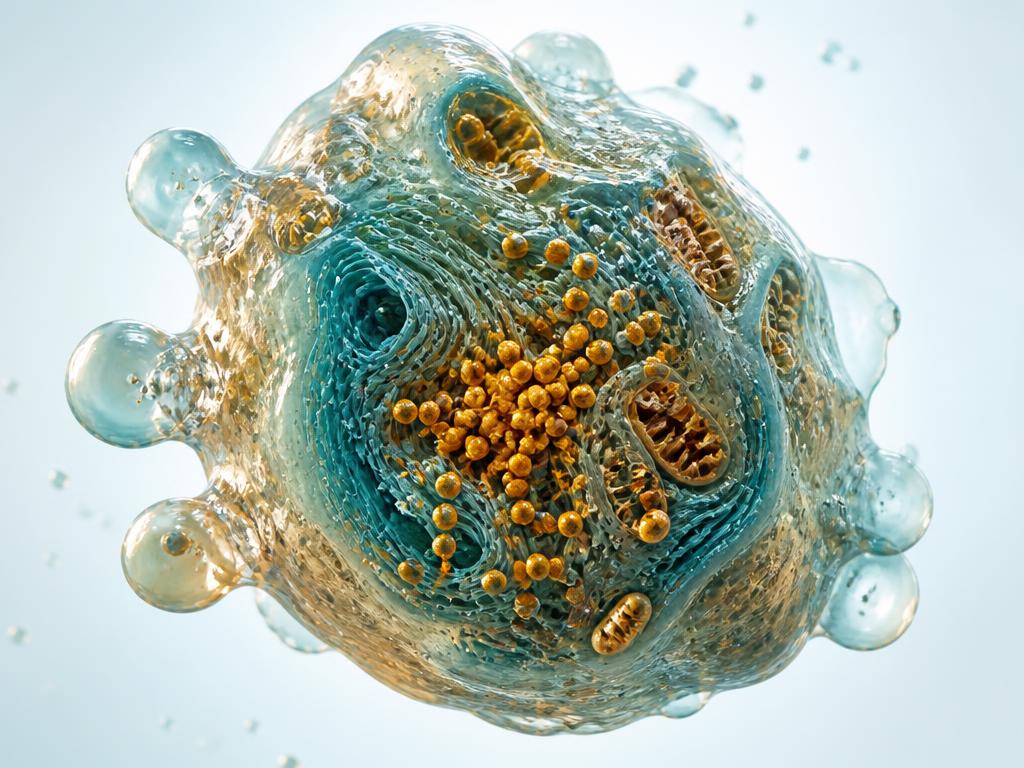
Stage 3 of Type 1 Diabetes disease development — Beta-cell stress
03
Silent
Beta-cell stress
ER and mitochondrial stress alter proteostasis.
Stage 4 of Type 1 Diabetes disease development — Inflammation
04
Silent
Inflammation
Insulitis initiated by CD8+ T-cell infiltration.
Stage 5 of Type 1 Diabetes disease development — Progressive apoptosis
05
Silent
Progressive apoptosis
Beta cells die at accelerating rates.
Stage 6 of Type 1 Diabetes disease development — cfDNA release
06
Detectable
cfDNA release
Beta-cell-specific methylated cfDNA rises — Beta Intercept™ signal.
Stage 7 of Type 1 Diabetes disease development — Autoantibody development
07
Detectable
Autoantibody development
GAD65, IA-2, ZnT8, IAA seroconversion detectable.
Stage 8 of Type 1 Diabetes disease development — Declining insulin
08
Detectable
Declining insulin
First-phase insulin response falls; C-peptide drops.
Stage 9 of Type 1 Diabetes disease development — Clinical progression
09
Clinical
Clinical progression
Hyperglycemia crosses diagnostic thresholds.
Stage 01 → Stage 09 · silent progression to clinical diagnosis
CLINICAL APPLICATIONS

Deployable across the T1D clinical continuum.

Early Risk Assessment
Molecular signal complements genetic and autoantibody risk.
First-Degree Relatives
Longitudinal monitoring for family members with elevated risk.
Autoantibody-Positive
Stage progression tracking in Stage 1 & Stage 2 T1D.
Clinical Trial Enrollment
Molecular eligibility criteria for interventional studies.
Disease-Modifying Therapy
Response monitoring for teplizumab & next-generation agents.
Longitudinal Monitoring
Serial BetaDx™ trajectories over months and years.
Residual Beta-Cell Function
Post-diagnosis reserve quantification.
Therapeutic Response
Pharmacodynamic endpoint for immunomodulatory therapy.
Research Studies
Academic collaborations across natural history & intervention.
Population Screening
Framework for at-risk cohort surveillance.
CURRENT CLINICAL RESEARCH

A collaborative research network across the T1D community.

Active studies with academic medical centers, natural history cohorts, and clinical trial groups. Selected collaborations shown.

SITE 01
Nemours Children's Health
Southeast US
Pediatric natural history & at-risk surveillance
SITE 02
University of Florida
Gainesville, FL
Molecular staging & autoimmune profiling
SITE 03
University of Miami DRI
Miami, FL
Islet biology & transplantation cohorts
SITE 04
Mayo Clinic
Rochester, MN
Adult-onset T1D and validation studies
SITE 05
TEDDY Study
International
Environmental determinants; longitudinal cohort
SITE 06
DAISY Study
Colorado
Autoimmunity in the young; genetic risk cohorts
Pharmaceutical clinical development team reviewing trial data
Pharmaceutical Applications

A molecular endpoint for the next generation of T1D therapeutics.

T1D programs are slowed by a structural problem: the endpoint arrives years after the biology. Beta Intercept™ measures the injury itself — giving development teams a direct, quantitative view of whether a therapy is protecting beta cells, while the trial is still running.

< 5 days
Sample to result
Central-lab turnaround per timepoint
Weeks
Time to first PD signal
vs. quarters for C-peptide separation
Continuous
Endpoint class
Quantitative % unmethylated, not a binary event
1 analyte
Across species
Same readout in vitro, in vivo, in humans
Without a molecular endpoint
  • Enrollment relies on risk categories, not disease activity
  • Efficacy signal waits on C-peptide decline or clinical conversion
  • Non-progressors dilute treatment effect
  • Large cohorts, long timelines, expensive readouts
  • Failure is discovered late, after the capital is committed
With Beta Intercept™
  • Enroll subjects with confirmed active beta-cell injury
  • Observe pharmacodynamic response within weeks
  • Quantitative, continuous, repeatable measurement
  • Smaller, faster, better-powered studies
  • Early, defensible go / no-go evidence

What molecular enrichment does to a study design.

Conventional at-risk design
Screened to enrollHigh
Subjects with active disease biologyUnknown
Cohort size requiredLarge
Time to interpretable readout24–36 months
Beta Intercept™ molecularly enriched design
Screened to enrollTargeted
Subjects with active disease biologyConfirmed
Cohort size requiredReduced
Time to interpretable readoutMonths, not years
Directional modeling of design impact — actual performance is protocol dependent.
01
Enrich the right patients

Molecular evidence of active beta-cell injury identifies subjects with measurable disease activity — collapsing the proportion of enrolled patients who will never progress inside the study window.

Higher event rate per enrolled subject
02
Read out earlier

cfDNA methylation responds within weeks. Pharmacodynamic signal is observable long before C-peptide or HbA1c separates between arms — de-risking go / no-go decisions before the spend.

Weeks to first signal vs. quarters
03
Power studies with fewer subjects

A continuous, quantitative endpoint replaces slow categorical conversion events, improving effect-size resolution at a given sample size — or holding power with a smaller cohort.

Continuous quantitative endpoint

Integrated across the development lifecycle

Discovery01
Target & mechanism
Quantify beta-cell death in models and human samples to confirm mechanism of protection.
Preclinical02
Translational bridge
The same analyte measured in vitro, in vivo, and in humans — one continuous readout across species.
Phase I / II03
Proof of biology
Early pharmacodynamic evidence that a candidate reduces active beta-cell injury.
Phase III04
Enrichment & stratification
Screen, stratify, and monitor an at-risk population defined by molecular activity, not risk scores alone.
Regulatory05
Biomarker strategy
Structured evidence packages designed to support biomarker qualification discussions.
Post-market06
Durability & surveillance
Longitudinal monitoring of sustained beta-cell preservation in real-world cohorts.

Partner capabilities

01
Patient identification
Find biologically active candidates within at-risk populations.
02
Trial enrollment
Molecular eligibility criteria layered onto autoantibody staging.
03
Companion diagnostics
Co-development pathway alongside disease-modifying therapies.
04
Pharmacodynamic monitoring
Dose- and schedule-finding informed by on-treatment signal.
05
Therapeutic response
Per-patient response classification across the treatment course.
06
Endpoint development
Surrogate endpoint evidence generation and analytic support.
07
Biomarker discovery
Multi-omic exploration on banked and prospective specimens.
08
Precision medicine
Intercept IQ™ models stratify likely responders from non-responders.
09
Longitudinal efficacy
Serial trajectories quantifying durability of benefit over years.

Three ways to engage

Model 01
Feasibility & pilot

Retrospective analysis of banked plasma to establish signal in your cohort before protocol commitment.

  • Banked specimen analysis
  • Signal feasibility report
  • Assay fit assessment
  • Statistical consultation
Model 02
Trial deployment

Beta Intercept™ embedded into an active protocol as a screening, stratification, or pharmacodynamic endpoint.

  • Protocol & endpoint design
  • Multi-site kit logistics
  • Central lab processing
  • Analysis-ready data delivery
Model 03
Companion diagnostic co-development

A jointly developed diagnostic paired to a disease-modifying therapy, built toward a regulatory submission.

  • Co-development agreement
  • Analytical & clinical validation
  • Regulatory strategy support
  • Commercial launch readiness
Analysis-ready datasets
CDISC-aligned structured exports per timepoint, per subject.
Quality documentation
Assay validation package, SOPs, and chain-of-custody records.
Trajectory analytics
Per-subject longitudinal curves with arm-level aggregation.
Secure data exchange
Encrypted transfer into sponsor and CRO data environments.
Operational profile
Specimen
Standard venous blood draw
Turnaround
< 5 days
Scalability
Multi-site, multi-national study support
Data delivery
Structured, analysis-ready datasets
Partner with Kihealth Labs

We work with sponsors from protocol design through readout — biomarker strategy, assay deployment, and longitudinal analytics for T1D programs.

Start a conversation
PROVIDER REPORT PREVIEW

A physician-facing report designed for clinical decisions.

Every result is interpreted, contextualized, and delivered via HL7 / FHIR into the existing electronic health record.

Beta Intercept™ · Clinical Report
Case ID · BI-2026-018492
Reported · July 07, 2026
Kihealth Labs · CLIA 10D2222222
Beta Intercept Score™
74
/ 100
Elevated · Stage 2
Clinical Interpretation

The patient demonstrates a rising beta-cell cfDNA signal in the setting of two positive islet autoantibodies. Findings are consistent with active pre-symptomatic Type 1 Diabetes (Stage 2). Consider referral for immunomodulatory therapy eligibility and enrollment in longitudinal monitoring.

BetaDx™
148
copies/mL
H
Ref: < 20
HbA1c
5.9
%
H
Ref: < 5.7
C-Peptide
1.1
ng/mL
Ref: 0.9–7.1
Insulin
6.4
µIU/mL
Ref: 2–25
GAD65
Positive
H
Ref: Negative
IA-2
Positive
H
Ref: Negative
ZnT8
Negative
Ref: Negative
IAA
Negative
Ref: Negative
Beta Intercept Score Trend
Percent Methylated
15.0%Rising
05101520V1V2V3V4V5V6
Serial visits · reference range < 5% · illustrative
Get in touch

Bring Beta Intercept™ into your clinic, program, or study.

Our scientific affairs team partners with clinicians, researchers, and pharmaceutical development groups to deploy Beta Intercept™ across the T1D continuum.