

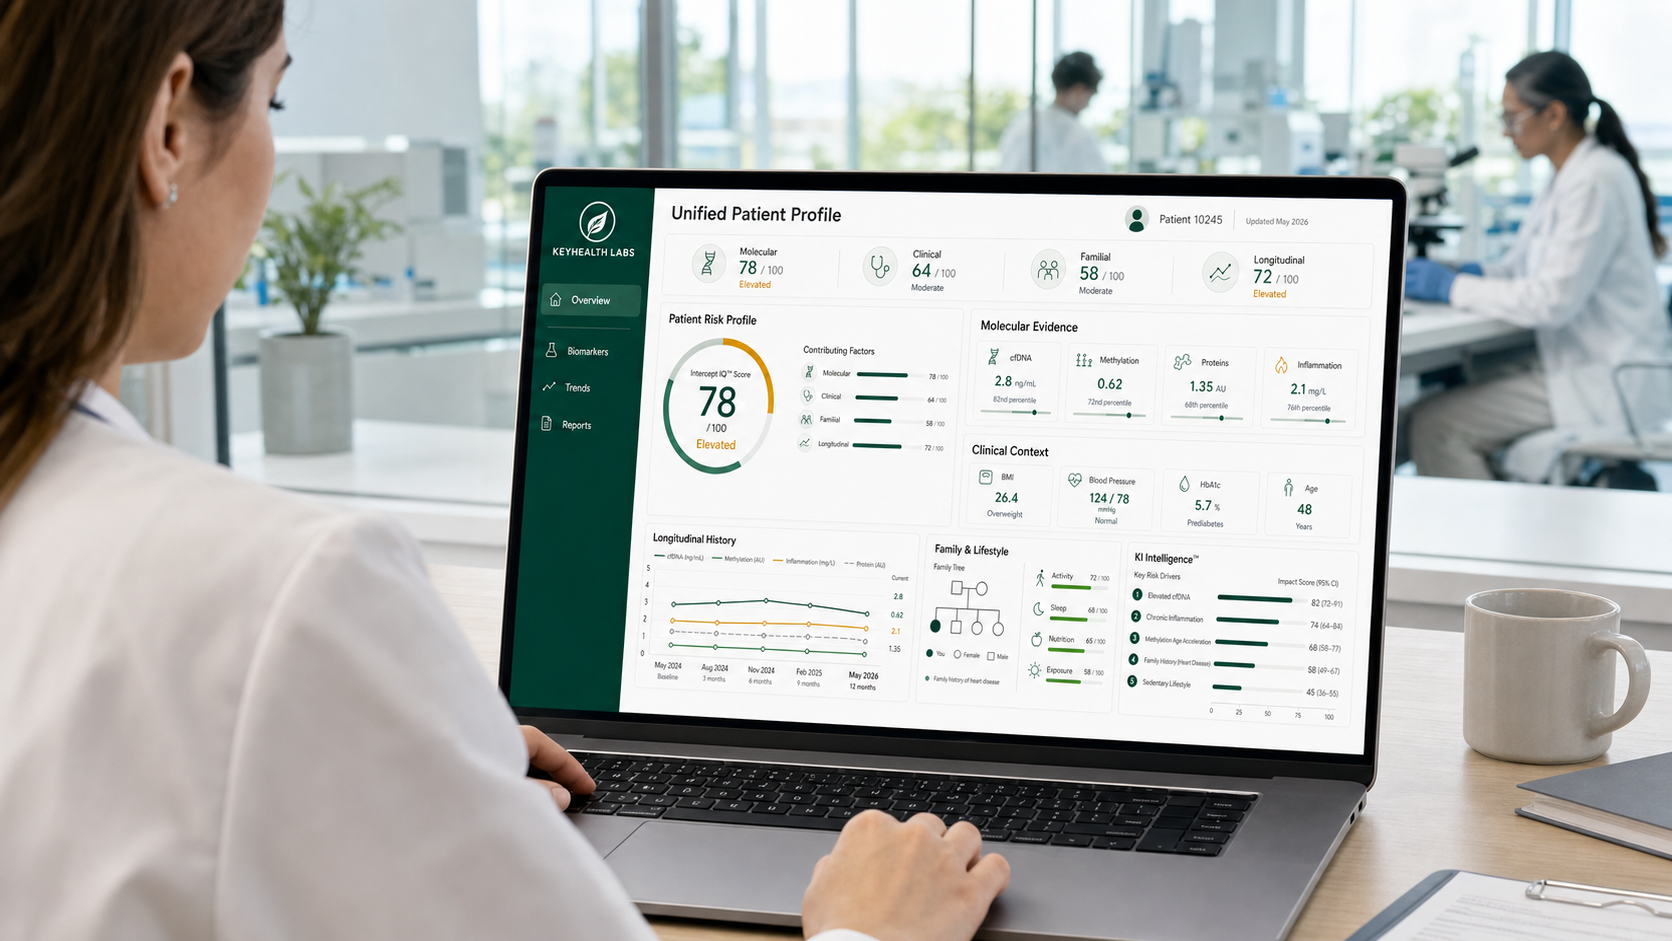

Kihealth Labs scientist reviewing a Ki Intelligence multi-omic AI analysis dashboard in a modern laboratory

KI Intelligence™

Molecular Intelligence for Earlier Disease Interception

Disease develops across multiple biological systems—but conventional diagnostics often evaluate those systems independently.

KI Intelligence™ brings molecular biomarkers, clinical factors, family history, physiological measurements, and longitudinal patient data together within a unified analytical platform. The result is a more complete view of an individual's changing risk profile and the intelligence needed to identify disease-related signals earlier.

One platform. Multiple dimensions of health. A clearer view of what may be developing.

The Data Foundation

A Multidimensional View of the Patient

KI Intelligence™ evaluates four distinct layers of patient information. Each layer contributes a different dimension of risk, creating a more complete understanding of the biological changes that may precede disease.

How the layers combine

Four perspectives. One patient-level interpretation.

Each data stream contributes distinct context. KI Intelligence™ brings them together to reveal patterns that no single input can provide on its own.

Molecular EvidencecfDNA · methylation · proteins01
Clinical ContextLaboratory data · vitals · history02
Familial RiskFamily history · inherited risk03
Longitudinal HistoryBaseline · direction · rate of change04
Clinician reviewing a unified patient profile dashboard on a laptop in a lab

Unified patient profile

A continuously informed view of the patient becomes the foundation for contextual risk interpretation.

KI Intelligence™Clinical intelligence
Scientist pipetting a plasma sample beside a molecular data readout

Molecular Evidence

Disease-associated signals generated through Kihealth Labs assays and molecular-analysis programs.

  • Circulating cell-free DNA
  • DNA methylation and epigenetic signatures
  • Disease-associated proteins
  • Gene-expression signals
  • Targeted genetic variants
  • Metabolic and inflammatory biomarkers
  • Multi-analyte biomarker panels
  • Longitudinal molecular changes

Physician reviewing a patient's history and risk factors during a visit

Familial & Behavioral Risk

Family history, inherited predisposition, lifestyle, and environmental factors that can modify the significance of an individual molecular signal.

  • Family history
  • Inherited predisposition
  • Lifestyle factors
  • Environmental exposures
Clinician reviewing a unified patient risk profile with a patient

Individual Patient Profile

A unified, longitudinal representation of molecular, clinical, physiological, and familial risk.

Molecular
Assay signals
Clinical
Context variables
Familial
Risk modifiers
Longitudinal
Trend over time

Clinician reviewing lab results and vital-sign measurements at a clinic desk

Clinical & Physiological Context

Patient-level variables that allow molecular findings to be interpreted within the appropriate clinical context.

  • Laboratory results and medical history
  • Age, biological sex, height, weight, and BMI
  • Medications and existing conditions
  • Blood pressure and physiological measurements
  • Relevant symptoms and clinical observations
Researcher reviewing repeated biomarker measurements trending over time

Longitudinal Patient History

Repeated measurements that distinguish an isolated result from a persistent biological trend.

  • Change from individual baseline
  • Rate and direction of change
  • Persistence across multiple tests
  • Movement across biomarkers
  • Response following an intervention

Research & Reference Data

Where appropriately licensed or authorized, development data may include de-identified clinical cohorts, published studies, genomic repositories, electronic health records, biobank data, and disease-specific research datasets.

Population-level evidence establishes reference patterns. Kihealth Labs’ proprietary assay and longitudinal patient data create the disease-specific intelligence layer.

Reference substrateProprietary layer
POPULATION
KIHEALTH
0relative contribution to model development100
  • R-01De-identified clinical cohortsCohort
  • R-02Published scientific studiesLiterature
  • R-03Genomic repositoriesGenomic
  • R-04Electronic health recordsClinical
  • R-05Biobank dataSpecimen
  • R-06Disease-specific research datasetsTargeted

The Analytical Architecture

Different Models. Different Scientific Questions.

KI Intelligence™ is not dependent on a single algorithm. It uses a disease-specific ensemble architecture in which each analytical method performs a defined function—from detecting abnormal molecular patterns to evaluating disease progression over time.

The models work together to convert complex patient data into a calibrated and clinically interpretable assessment of risk.

  1. 01 Quality Control
  2. 02 Feature Engineering
  3. 03 Disease-Specific Modeling
  4. 04 Ensemble Integration
  5. 05 Risk Calibration
STAGE 01

Quality Control & Harmonization

Before modeling begins, incoming measurements are evaluated for completeness, consistency, analytical variation, and potential confounding factors.

  • Missing-value assessment
  • Assay and batch normalization
  • Measurement consistency
  • Outlier and artifact detection
Laboratory scientist loading a 96-well plate into an automated liquid-handling instrument
Automated sample handling and data integrity checks
STAGE 02

Disease-Specific Feature Engineering

Raw measurements are transformed into clinically meaningful analytical features that can reveal relationships not visible through isolated biomarkers.

  • Biomarker ratios
  • Composite molecular signatures
  • Interaction effects
  • Change from individual baseline
  • Rate and direction of change
  • Cross-domain risk variables
Computational biologist reviewing genomic methylation data visualizations on a large monitor
Measurement to structured feature engineering
STAGE 03

Specialized Model Layer

Complementary statistical and machine-learning models evaluate different dimensions of patient risk. Select a method to view the scientific question it addresses and the result it contributes to the ensemble.

Model selection is determined by the disease, biomarker profile, available evidence, intended use, and validation requirements.

STAGE 04

Ensemble Integration

Outputs from complementary models are weighted and combined to reduce dependence on any single analytical method or individual biomarker.

  • Greater analytical stability
  • Reduced single-model dependency
  • Integration of complementary risk signals
Data scientists reviewing machine-learning model dashboards on a wall of screens
Model training and weighted ensemble integration
STAGE 05

Calibration & Clinical Translation

The composite model output is calibrated against defined clinical outcomes and translated into a consistent, interpretable risk framework.

  • Probability calibration
  • Risk-threshold development
  • Confidence and uncertainty assessment
  • Subgroup performance analysis
  • Clinical interpretability
Calibrated Disease-Specific Risk
Clinician reviewing a calibrated patient risk dashboard on a tablet with a patient
Calibrated risk delivered at the point of care

Proprietary Architecture

The Proprietary Value Is in the Architecture

Individual modeling techniques are widely available. The proprietary advantage of KI Intelligence™ is created through the disease-specific combination of Kihealth Labs biomarkers, assay-aware normalization, engineered molecular features, longitudinal patient baselines, model weighting, outcome linkage, and risk calibration.

  1. 01

    Proprietary Biomarkers

  2. 02

    Assay-Aware Normalization

  3. 03

    Disease-Specific Features

  4. 04

    Longitudinal Baselines

  5. 05

    Complementary Models

  6. 06

    Clinical Outcome Linkage

  7. 07

    Calibrated Risk Intelligence

The architecture is designed to become more differentiated as Kihealth Labs generates additional assay data, longitudinal measurements, and linked clinical outcomes.

The Proprietary Intelligence Layer

The Advantage Is Not the Algorithm Alone

Public datasets and commonly available machine-learning methods are accessible to many organizations. The proprietary value of KI Intelligence™ is created through how Kihealth Labs generates, structures, interprets, and validates disease-specific data.

Algorithms can be replicated. A continuously expanding system of proprietary assays, longitudinal patient data, engineered features, and linked clinical outcomes is significantly more difficult to reproduce.

Six connected sources of proprietary value

01

Proprietary Biomarker Combinations

KI Intelligence™ evaluates disease-specific combinations of biomarkers selected through Kihealth Labs’ discovery, translational, and clinical-development programs.

Biomarker selection · Multi-analyte signatures · Disease-specific panels

02

Assay-Aware Normalization

Laboratory variables—including sample quality, collection conditions, analytical platform, batch effects, and limits of detection—are incorporated into data-quality and normalization processes.

Sample integrity · Collection variability · Batch correction · Analytical limits

03

Disease-Specific Feature Engineering

Raw measurements are transformed into analytical features that reveal relationships not apparent through the independent interpretation of individual biomarkers.

Biomarker ratios · Composite signatures · Interaction effects · Cross-domain relationships

04

Patient-Specific Baselines

Where longitudinal results are available, the patient can increasingly serve as their own biological reference—helping identify meaningful changes that may remain within broad population reference ranges.

Individual baseline · Rate of change · Direction · Persistence

05

Proprietary Outcome Linkage

Biomarker profiles become more valuable when connected to longitudinal clinical outcomes. These relationships help identify patterns associated with stability, progression, intervention, or clinical conversion.

Biomarker trajectory · Clinical outcome · Intervention response · Disease progression

06

Calibrated Risk Translation

Model outputs are calibrated into defined risk categories and score ranges designed to remain consistent and interpretable across patient populations and testing periods.

Risk calibration · Decision thresholds · Population performance · Clinical interpretation

The Compounding Moat

The moat is the cumulative relationship among proprietary assays, engineered features, longitudinal patient data, clinical outcomes, and disease-specific validation.

Each additional validated assay, patient measurement, and linked outcome strengthens the intelligence architecture supporting current and future Intercept programs.

How the moat compounds

Each layer below feeds the next. Proprietary assays produce engineered features, which accumulate longitudinal data, which link to clinical outcomes, which in turn receive disease-specific validation. The cycle then begins again—each pass making the whole architecture harder to replicate.

01Proprietary Assays
02Engineered Features
03Longitudinal Data
04Clinical Outcomes
05Disease-Specific Validation
Clinician reviewing an Intercept IQ risk score dashboard with a patient

THE INTERCEPT IQ™ SCORE

A Dynamic Measure of Disease-Associated Risk

The Intercept IQ™ Score translates a complex, multidimensional analysis into a standardized disease-specific risk assessment.

It is designed to communicate more than whether a result is simply “positive” or “negative.”

ILLUSTRATIVE PATIENT EXAMPLE

INTERCEPT IQ™ RISK PROFILE

Integrated molecular and clinical risk assessment

CURRENT ASSESSMENT

May 2026

INTERCEPT IQ™ SCORE

78/100

ELEVATED

LOWMODERATEELEVATED
Previous Score
64
Change
+14
Trend
Increasing

Illustrative values shown for design purposes.

Risk Trajectory

REFERENCE RANGE30507090BASELINEPREVIOUSCURRENT

Risk has increased across consecutive measurements, with the greatest change occurring during the most recent testing interval.

CHANGE FROM BASELINE

+22%

RECENT RATE OF CHANGE

Increasing

Primary Risk Drivers

  • 01Molecular biomarker pattern

    High contribution

  • 02Change from patient baseline

    Moderate contribution

  • 03Clinical and physiological context

    Moderate contribution

  • 04Familial risk profile

    Supporting contribution

CONFIDENCE RANGE

74–82

The range reflects model uncertainty and variation within the available patient data.

Current Risk

A standardized disease-specific assessment based on the patient's current molecular and clinical profile.

Change Over Time

Comparison with prior results reveals whether measured risk is stable, increasing, or decreasing.

Why It Changed

Contributing biomarkers and clinical factors provide context for the current result.

What Happens Next

A defined monitoring or follow-up pathway connects the result with an appropriate next step.

Recommended Monitoring Pathway

REVIEW

Clinician reviews the score, contributing factors, and relevant patient history.

MONITOR

Follow-up timing is determined according to the assay's validated intended use.

REASSESS

Future results are compared with the patient's baseline and prior trajectory.

Follow-up recommendations are assay-specific and should be interpreted by a qualified healthcare professional within the appropriate clinical context.

A score should never be presented without context.

KI Intelligence™ is designed to show why risk has changed, which signals are driving the result, and how the patient's current profile compares with relevant reference populations and their own prior baseline.

Clinical and research team reviewing longitudinal risk trajectory charts and molecular data around a lab table

From Risk Prediction to Disease Interception

Creating an Earlier Window for Action

Disease prevention often begins before a definitive diagnosis—but only if risk can be identified early enough to act.

KI Intelligence™ is designed to recognize the transition between background susceptibility and measurable biological change.

TIMEDISEASE-ASSOCIATED RISKPOTENTIAL WINDOW FOR EARLIER ACTIONPATIENT BASELINE0102030405CLINICAL REVIEWINCREASINGSTABLEDECREASING / RESPONDING
01Susceptibility

Background Susceptibility

Family history, inherited factors, lifestyle, and existing clinical characteristics establish the patient's baseline risk.

Family history · Genetics · Lifestyle · Clinical characteristics

02Emerging Molecular Change

Emerging Molecular Change

Disease-associated biomarkers begin to move, interact, or deviate from the patient's previous baseline.

Biomarker movement · Molecular interaction · Baseline deviation

03Quantified Interception Window

Quantified Interception Window

KI Intelligence™ evaluates whether the observed changes form a meaningful and persistent disease-associated risk pattern.

Pattern persistence · Direction · Velocity · Integrated risk

04Clinical Action

Clinically Appropriate Follow-Up

The resulting intelligence may support additional testing, increased surveillance, specialist referral, or an evidence-based intervention pathway.

Additional testing · Surveillance · Referral · Intervention pathway

05Longitudinal Reassessment

Longitudinal Reassessment

Subsequent testing evaluates whether the patient's measured risk trajectory is stable, increasing, decreasing, or responding following an intervention.

Stable · Increasing · Decreasing · Response monitoring

What KI Intelligence™ Evaluates

Persistence of change
Direction of risk
Velocity of change
Combined molecular and clinical context

The objective is not simply to predict disease. It is to create a clinically useful window in which its trajectory may still be changed.

By identifying persistent biological change before conventional diagnostic thresholds are reached, KI Intelligence™ is designed to support more informed monitoring, evaluation, and clinically appropriate action.

This visualization is conceptual. Interception windows, risk thresholds, follow-up pathways, and clinical actions are disease- and assay-specific and must be established through appropriate validation.

A Platform Built to Expand

One Intelligence Architecture. Multiple Disease Programs.

KI Intelligence™ provides a common analytical foundation for multiple disease-specific programs—allowing Kihealth Labs to apply the same data, modeling, validation, and risk-translation infrastructure across a growing portfolio of assays.

Disease Programs

METABOLIC

Beta Intercept™

Metabolic dysfunction and diabetes-related risk.

Metabolic biomarkers · Longitudinal glycemic risk · Earlier disease visibility

NEUROLOGICAL

Neuro Intercept™

Neurological and neurodegenerative disease risk.

Neurological biomarkers · Disease-associated change · Longitudinal monitoring

ONCOLOGY

Onco Intercept™

Cancer-associated molecular risk.

Cancer-associated signals · Molecular risk patterns · Earlier evaluation pathways

EXPANDING PIPELINE

Future Intercept Programs

Additional disease applications developed through the same data, modeling, validation, and risk-translation infrastructure.

New biomarkers · New disease models · New assay applications

Disease-Specific Translation

Biomarker Strategy

Disease-specific biomarker combinations and multi-analyte signatures.

Model Configuration

Analytical methods selected according to the disease, evidence, and intended use.

Clinical Validation

Performance evaluated within disease-specific populations and clinical pathways.

Risk Translation

Model outputs calibrated into interpretable scores, categories, and monitoring frameworks.

Common Analytical Foundation

KI Intelligence™

A reusable intelligence architecture for integrating patient data, engineering disease-specific features, modeling risk, linking outcomes, and translating complex analysis into clinically interpretable information.

DATA HARMONIZATIONFEATURE ENGINEERINGENSEMBLE MODELINGLONGITUDINAL ANALYSISRISK CALIBRATIONCONTINUOUS VALIDATION
Extensible by Design

New disease programs can be developed without rebuilding the underlying analytical infrastructure.

The signal begins in a single tube of blood.

Liquid Biopsy

The signal begins in a single tube of blood.

Cell-free DNA, methylation marks, and circulating proteins carry a real-time read-out of tissue biology — long before symptoms and often before conventional labs shift.

Regulated laboratory science, not a black box.

Molecular Analysis

Regulated laboratory science, not a black box.

Every Intercept IQ™ result begins with rigorous wet-lab chemistry — sample stabilization, extraction, and quantification — before any computational analysis is applied.

Designed to support — not replace — the clinician.

Clinical Interpretation

Designed to support — not replace — the clinician.

Molecular intelligence is delivered as a physician-facing report grounded in biology, calibrated against validated reference ranges, and interpretable in the context of the individual patient.

Why Molecular Intelligence Matters

Earlier Signals. Deeper Context. Broader Scientific Value.

Molecular intelligence becomes valuable when complex biological data can be translated into information that advances patient monitoring, diagnostic development, clinical research, and therapeutic discovery.

01

Earlier Biological Insight

Identify disease-associated molecular changes that may emerge before conventional clinical findings or diagnostic thresholds are reached.

Potential Value

An earlier opportunity for evaluation, monitoring, and clinically appropriate action.


02

Longitudinal Monitoring

Measure how biomarkers and integrated risk profiles change across multiple time points.

Potential Value

Distinguish temporary variation from persistent biological change and evaluate whether a patient's trajectory is stable, increasing, decreasing, or responding following an intervention.


03

Biomarker Discovery

Investigate relationships among molecular signals, patient characteristics, clinical information, and longitudinal outcomes.

Potential Value

Prioritize promising biomarkers, composite signatures, and disease-associated patterns for future diagnostic development.


04

Precision Therapeutics

Support research into why disease progression and therapeutic response vary among patients.

Potential Value

Inform patient stratification, identify potential responder subgroups, and explore biomarkers associated with treatment response or resistance.


05

Pharmaceutical Development

Apply biomarker and risk intelligence across therapeutic-development programs.

Potential Value

Support cohort enrichment, clinical-trial recruitment, response monitoring, biomarker-defined endpoints, and companion or complementary diagnostic development.


06

Platform Expansion

Apply a common data, modeling, governance, and validation infrastructure across multiple disease areas.

Potential Value

Develop new disease-specific programs without rebuilding the underlying intelligence architecture for every assay.

From Biological Complexity to Clinical and Scientific Utility

KI Intelligence™ is designed to create value across the molecular-intelligence continuum—from identifying earlier biological change to developing new diagnostics, supporting therapeutic research, and expanding the Kihealth Labs disease-interception portfolio.

01Earlier Biological Insight
02Longitudinal Understanding
03Diagnostic Discovery
04Therapeutic Research
05Platform Expansion
Scientists reviewing molecular data in a bright modern laboratory

Precision Diagnostics Powered by Molecular Intelligence

Advancing the Future of Precision Medicine

The Intercept IQ™ & molecular intelligence engine combine advanced laboratory science, liquid biopsy technologies, multi-omic biomarker analysis, and computational biology to support the next generation of precision diagnostics. By translating complex molecular information into clinically meaningful insights, the platform is designed to accelerate disease interception, biomarker discovery, and precision medicine across multiple therapeutic areas.